## Line Chart: Solar-10.7B-Chat Loss vs. Epoch
### Overview
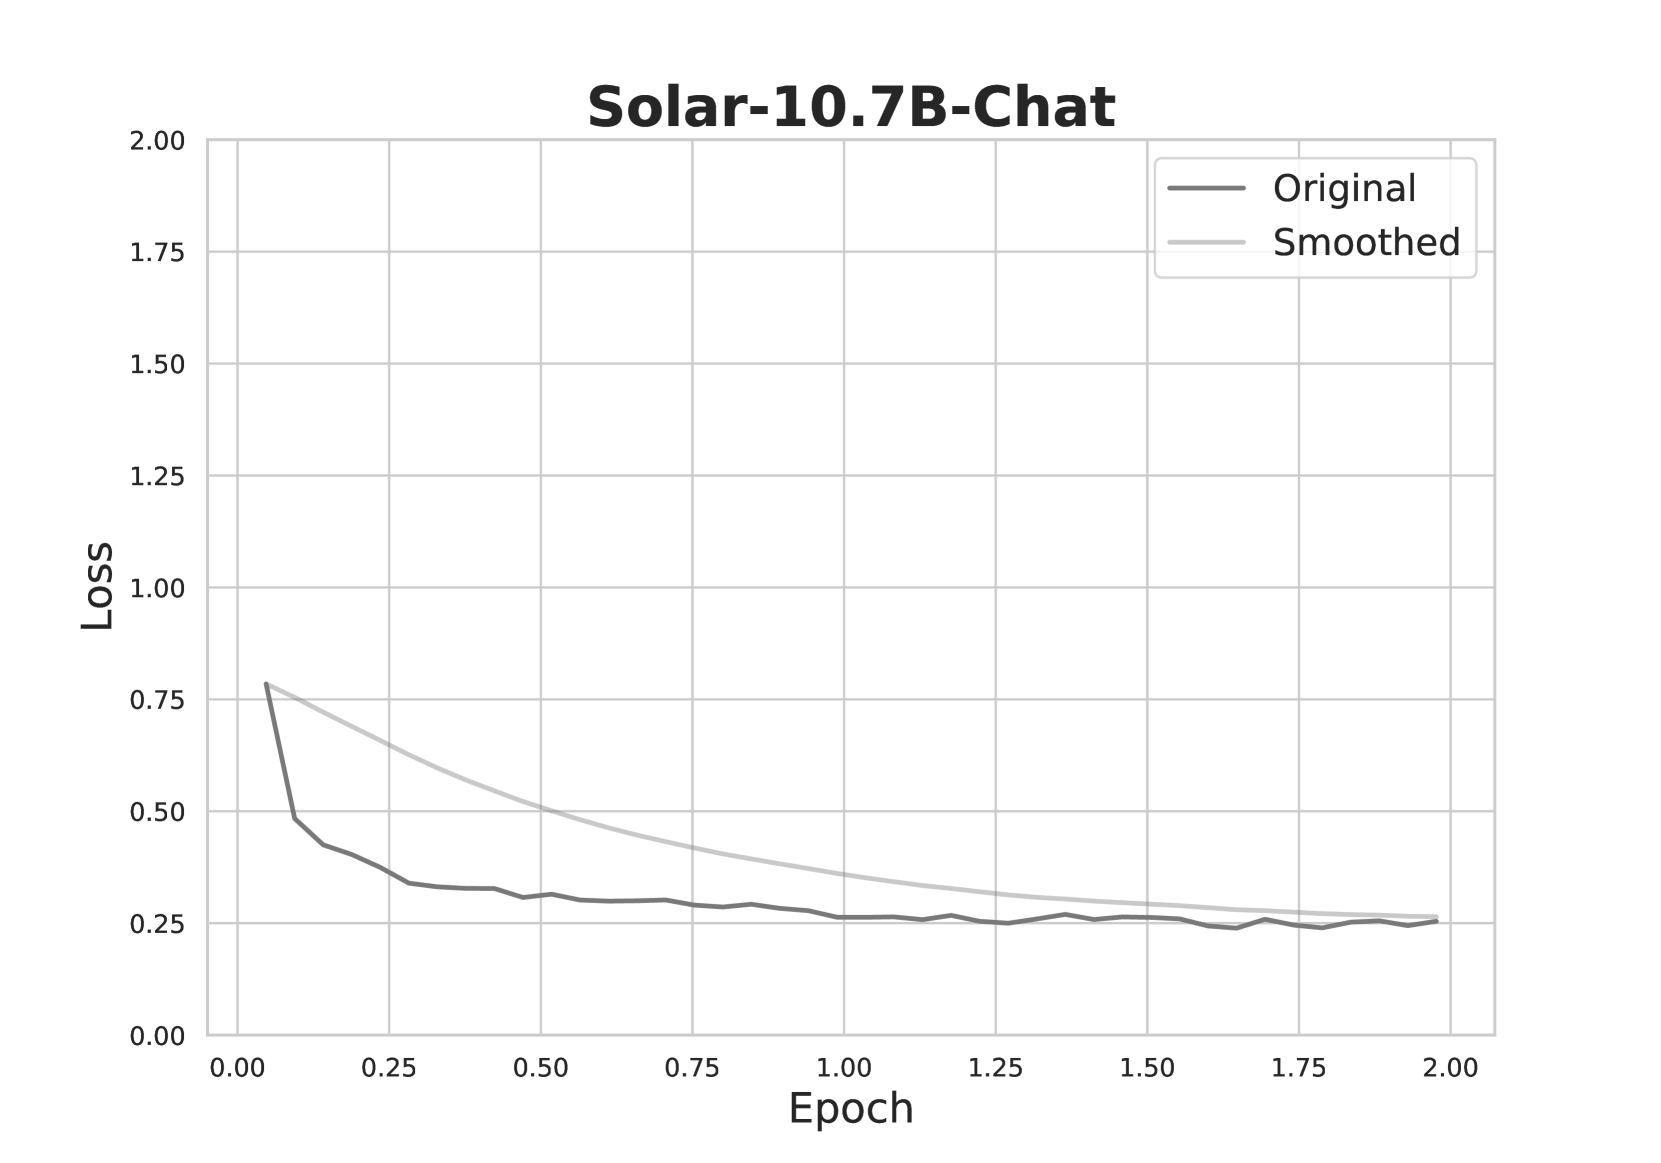
The image is a line chart displaying the training loss of the Solar-10.7B-Chat model over epochs. Two lines are plotted: "Original" loss and "Smoothed" loss. The chart shows the loss decreasing over time, indicating learning.
### Components/Axes
* **Title:** Solar-10.7B-Chat
* **X-axis:** Epoch
* Scale: 0.00 to 2.00, with increments of 0.25
* **Y-axis:** Loss
* Scale: 0.00 to 2.00, with increments of 0.25
* **Legend:** Located in the top-right corner.
* Original (Dark Gray line)
* Smoothed (Light Gray line)
### Detailed Analysis
* **Original Loss (Dark Gray):**
* Trend: Rapidly decreases initially, then plateaus with minor fluctuations.
* Data Points:
* Epoch 0.00: Loss ~0.80
* Epoch 0.25: Loss ~0.33
* Epoch 0.50: Loss ~0.31
* Epoch 1.00: Loss ~0.27
* Epoch 1.50: Loss ~0.26
* Epoch 2.00: Loss ~0.26
* **Smoothed Loss (Light Gray):**
* Trend: Decreases gradually and smoothly.
* Data Points:
* Epoch 0.00: Loss ~0.80
* Epoch 0.25: Loss ~0.50
* Epoch 0.50: Loss ~0.42
* Epoch 1.00: Loss ~0.35
* Epoch 1.50: Loss ~0.28
* Epoch 2.00: Loss ~0.26
### Key Observations
* The "Original" loss fluctuates more than the "Smoothed" loss, as expected.
* Both lines converge towards a loss value of approximately 0.26 by the end of the training period (2.00 Epochs).
* The most significant drop in loss occurs within the first 0.25 epochs.
### Interpretation
The chart illustrates the training progress of the Solar-10.7B-Chat model. The decreasing loss indicates that the model is learning and improving its performance over time. The "Smoothed" loss provides a clearer view of the overall trend by averaging out the fluctuations in the "Original" loss. The convergence of both lines suggests that the model is approaching a stable state, and further training may yield diminishing returns. The initial rapid decrease in loss highlights the importance of the early training stages.