## Line Chart: Solar-10.7B-Chat Training Loss
### Overview
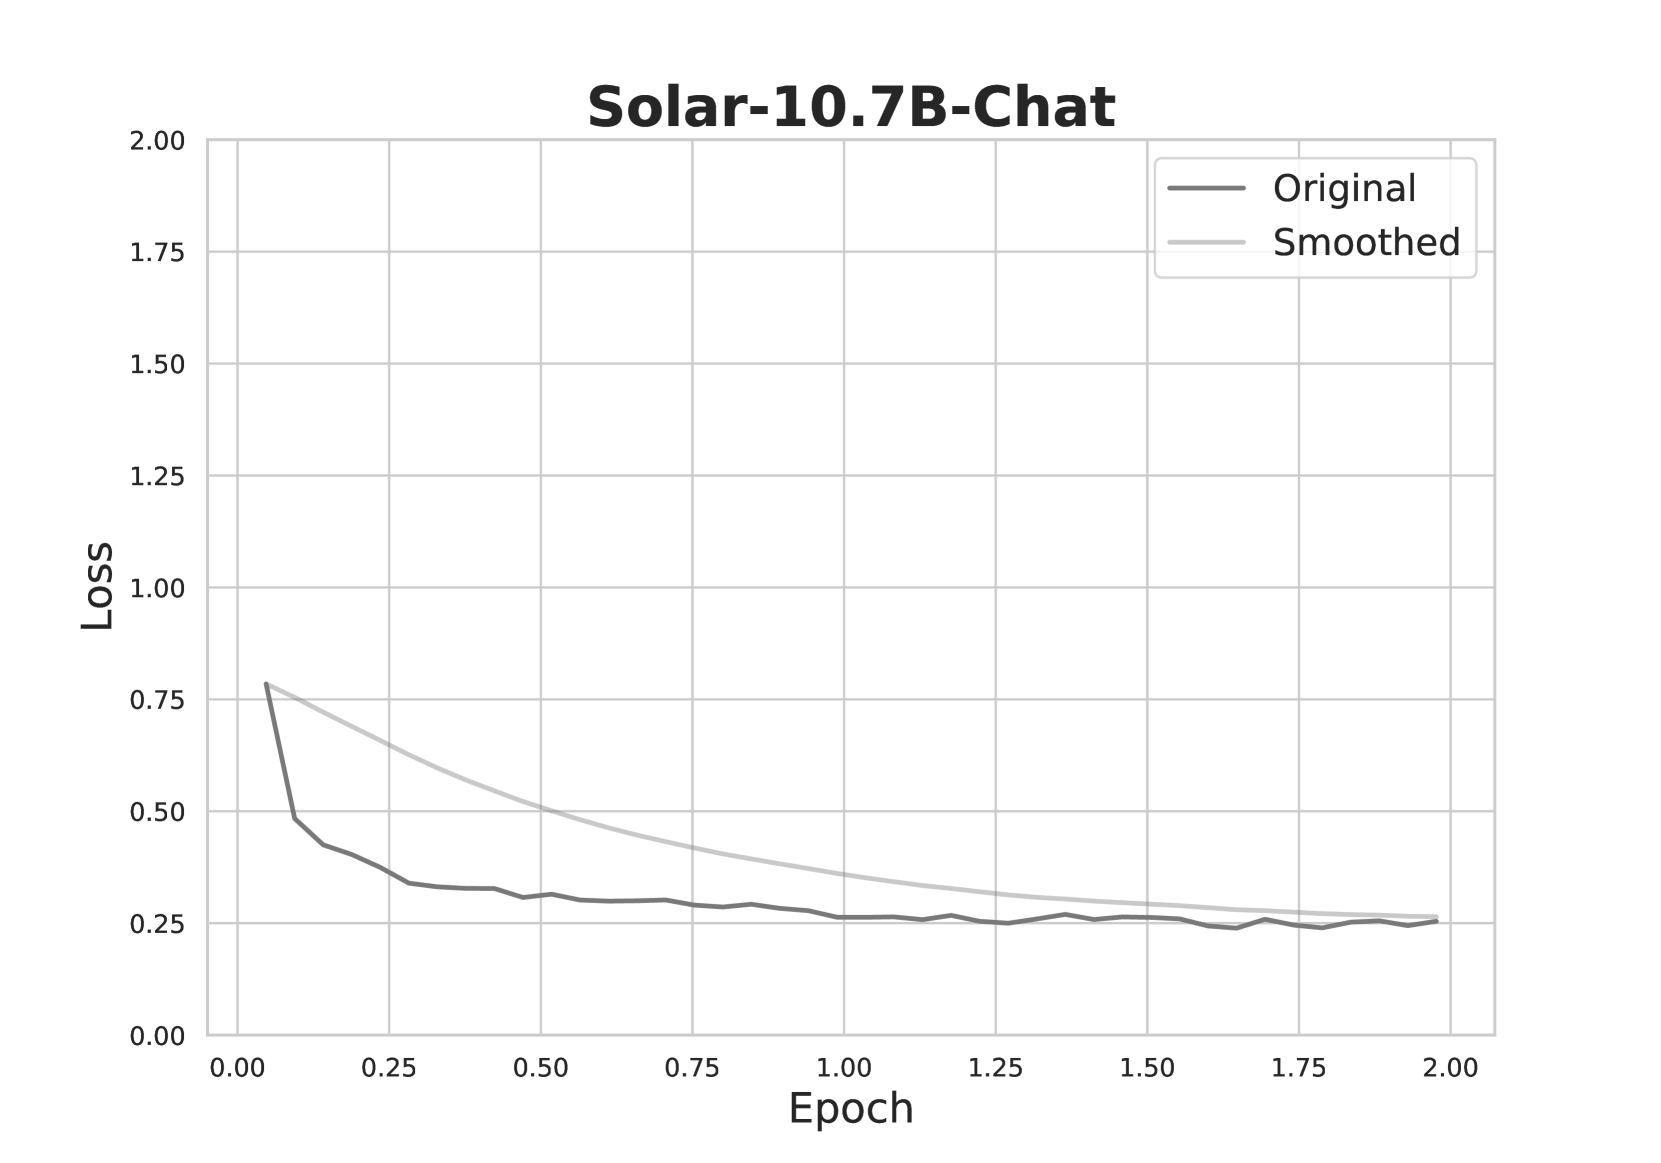
This image is a line chart titled "Solar-10.7B-Chat," displaying the training loss of a machine learning model over a series of epochs. It plots two data series: the raw, "Original" loss values and a "Smoothed" version of the same data. The chart demonstrates a classic learning curve where the model's error (loss) decreases as training progresses.
### Components/Axes
* **Title:** "Solar-10.7B-Chat" (centered at the top).
* **Y-Axis (Vertical):** Labeled "Loss". The scale runs from 0.00 to 2.00, with major gridlines and numerical markers at intervals of 0.25 (0.00, 0.25, 0.50, 0.75, 1.00, 1.25, 1.50, 1.75, 2.00).
* **X-Axis (Horizontal):** Labeled "Epoch". The scale runs from 0.00 to 2.00, with major gridlines and numerical markers at intervals of 0.25 (0.00, 0.25, 0.50, 0.75, 1.00, 1.25, 1.50, 1.75, 2.00).
* **Legend:** Located in the top-right corner of the plot area. It contains two entries:
* A dark gray line labeled "Original".
* A light gray line labeled "Smoothed".
* **Plot Area:** Contains a light gray grid for reference.
### Detailed Analysis
**Data Series & Trends:**
1. **"Original" Line (Dark Gray):**
* **Trend:** Exhibits a very steep, near-vertical decline at the beginning of training, followed by a rapid deceleration in the rate of decrease, eventually plateauing with minor fluctuations.
* **Approximate Data Points:**
* Epoch 0.00: Loss ≈ 0.78
* Epoch 0.05: Loss ≈ 0.48 (sharp drop)
* Epoch 0.25: Loss ≈ 0.35
* Epoch 0.50: Loss ≈ 0.30
* Epoch 1.00: Loss ≈ 0.26
* Epoch 1.50: Loss ≈ 0.25
* Epoch 2.00: Loss ≈ 0.25
2. **"Smoothed" Line (Light Gray):**
* **Trend:** Shows a smooth, continuous, and decelerating downward curve. It starts at approximately the same point as the Original line but decreases more gradually, acting as a trendline that filters out the noise/fluctuations of the raw data.
* **Approximate Data Points:**
* Epoch 0.00: Loss ≈ 0.78
* Epoch 0.25: Loss ≈ 0.60
* Epoch 0.50: Loss ≈ 0.48
* Epoch 0.75: Loss ≈ 0.40
* Epoch 1.00: Loss ≈ 0.35
* Epoch 1.50: Loss ≈ 0.28
* Epoch 2.00: Loss ≈ 0.26
**Spatial Grounding & Cross-Reference:**
The legend is positioned in the top-right quadrant. The dark gray "Original" line is consistently below the light gray "Smoothed" line after the initial point, confirming the legend's color mapping. Both lines converge to a very similar value (≈0.25-0.26) by Epoch 2.00.
### Key Observations
1. **Rapid Initial Learning:** The most significant reduction in loss occurs within the first 0.25 epochs, indicating the model quickly learns the most prominent patterns in the data.
2. **Diminishing Returns:** After approximately Epoch 0.50, the rate of loss reduction slows dramatically. The curve flattens, suggesting the model is fine-tuning or has reached a performance plateau for this training phase.
3. **Convergence:** The "Original" and "Smoothed" lines converge towards the end of the plotted range (Epoch 2.00), indicating that the smoothed trend accurately reflects the final, stable loss value.
4. **Low Final Loss:** The final loss value (≈0.25) is relatively low on the provided scale (0-2), suggesting successful model training on the given task.
### Interpretation
This chart is a fundamental diagnostic tool for monitoring the training of the "Solar-10.7B-Chat" model. The data suggests the training process was effective and stable.
* **What the data demonstrates:** The model successfully learned from the training data, as evidenced by the consistent decrease in loss. The shape of the curve is typical for gradient-based optimization, where large initial gains are followed by smaller, incremental improvements.
* **Relationship between elements:** The "Smoothed" line provides a clear view of the underlying learning trend, while the "Original" line shows the inherent variability or noise in the loss calculation at each step. Their convergence validates that the smoothing process did not distort the final outcome.
* **Notable implications:** The plateau after Epoch 1.00 could indicate several possibilities: the model may have reached its capacity for the given data and architecture, the learning rate might need adjustment for further gains, or additional training epochs may yield only marginal improvements. The chart does not show signs of overfitting (which would be indicated by a rising loss on a validation set, not shown here) or training instability (e.g., wild spikes). The primary takeaway is that the core learning phase was completed efficiently within the first half of the displayed training period.