## Line Chart: Solar-10.7B-Chat Loss Over Epochs
### Overview
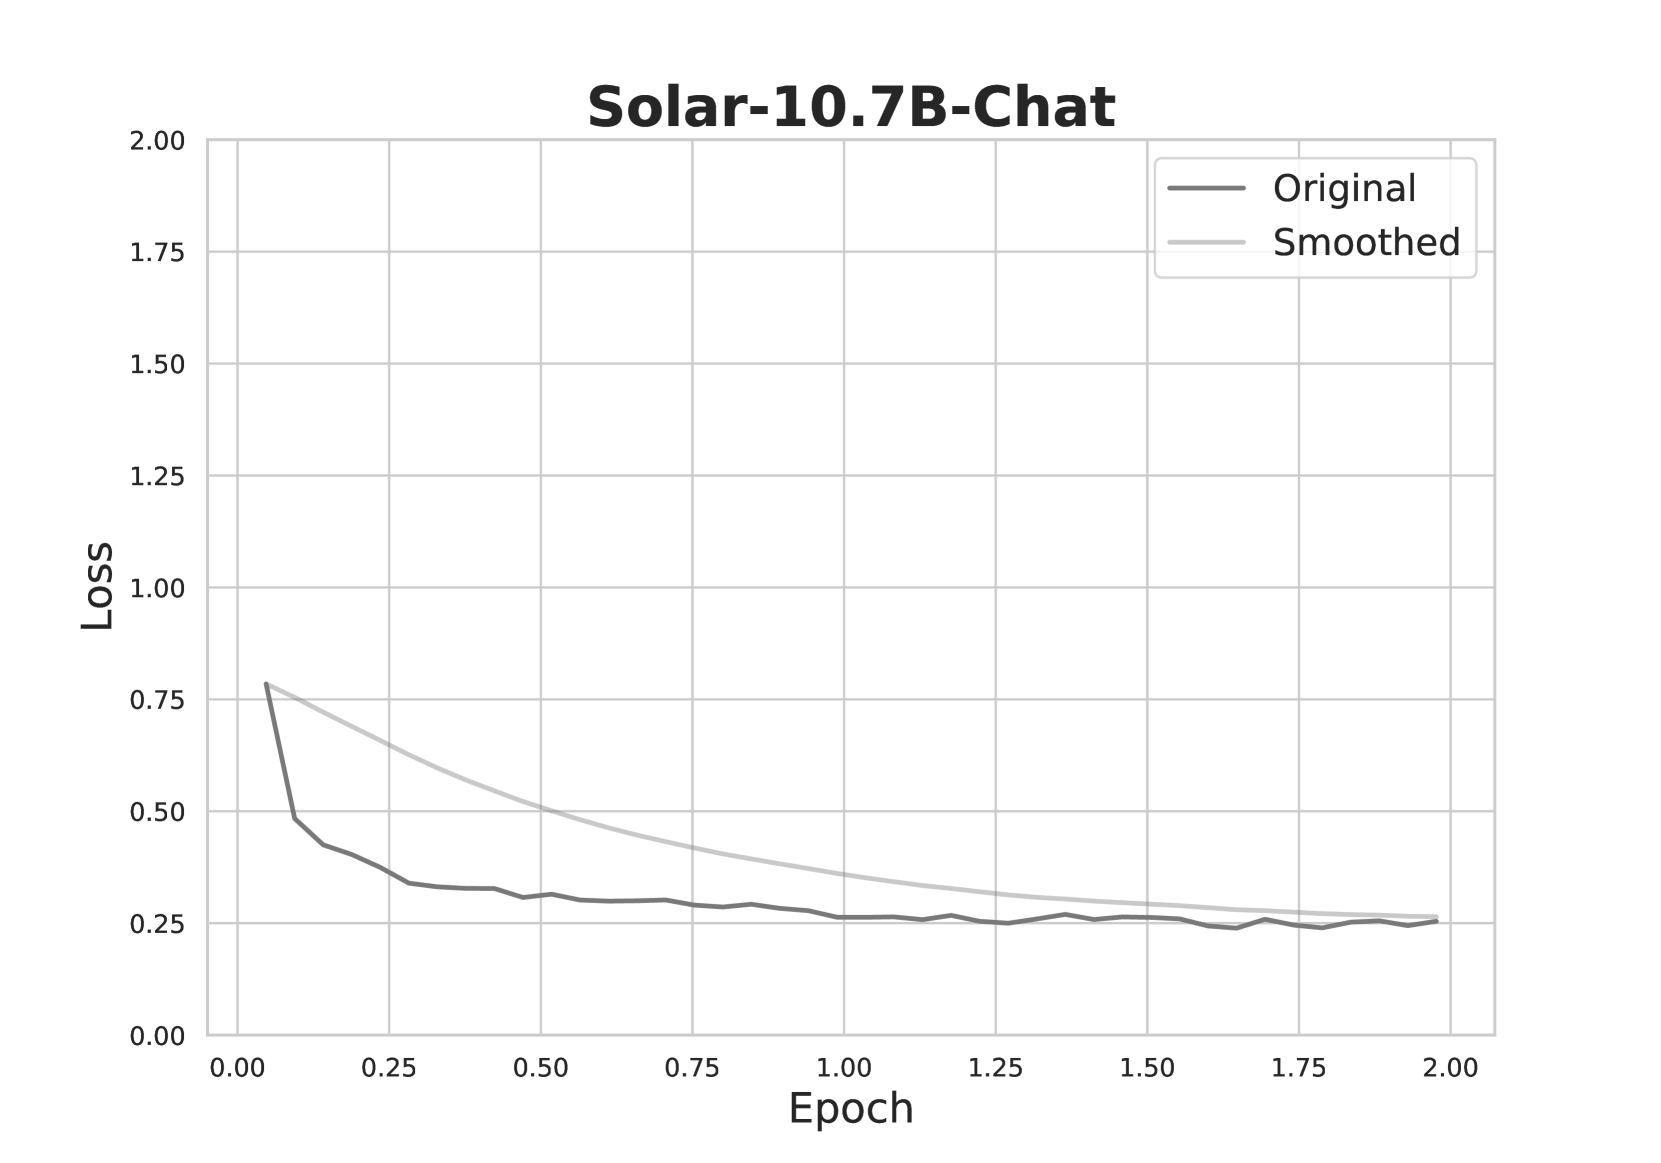
The chart visualizes the loss reduction of a model named "Solar-10.7B-Chat" across 2.00 epochs. Two lines are plotted: "Original" (black) and "Smoothed" (gray), showing distinct trends in loss values over time.
### Components/Axes
- **X-axis (Epoch)**: Ranges from 0.00 to 2.00 in increments of 0.25.
- **Y-axis (Loss)**: Ranges from 0.00 to 2.00 in increments of 0.25.
- **Legend**: Located in the top-right corner, with "Original" (black line) and "Smoothed" (gray line) labels.
- **Title**: "Solar-10.7B-Chat" is centered at the top of the chart.
### Detailed Analysis
1. **Original Line (Black)**:
- Starts at **~0.75 loss** at epoch 0.00.
- Drops sharply to **~0.25 loss** by epoch 0.5.
- Fluctuates slightly between **0.20–0.30 loss** from epoch 0.5 to 2.00.
- Ends at **~0.25 loss** at epoch 2.00.
2. **Smoothed Line (Gray)**:
- Begins at **~0.75 loss** at epoch 0.00.
- Decreases gradually to **~0.25 loss** by epoch 2.00.
- Maintains a steady decline with minimal fluctuations.
- Ends at **~0.25 loss** at epoch 2.00.
### Key Observations
- The "Original" line exhibits a **steep initial decline** followed by stabilization, while the "Smoothed" line shows a **consistent, gradual decrease**.
- Both lines converge near **0.25 loss** by epoch 2.00, suggesting alignment in long-term performance.
- The "Smoothed" line’s reduced volatility implies it filters short-term noise in the loss metric.
### Interpretation
The data demonstrates that the "Original" loss metric experiences rapid improvement early in training but plateaus, whereas the "Smoothed" metric provides a more stable representation of progress. This suggests that smoothing techniques effectively mitigate epoch-to-epoch variability, offering a clearer view of sustained model performance. The convergence at epoch 2.00 indicates that both metrics ultimately reflect similar loss values, though the "Smoothed" line’s gradual decline may better represent long-term optimization trends.