## Chart Type: Line Graphs Comparing Attention Weights
### Overview
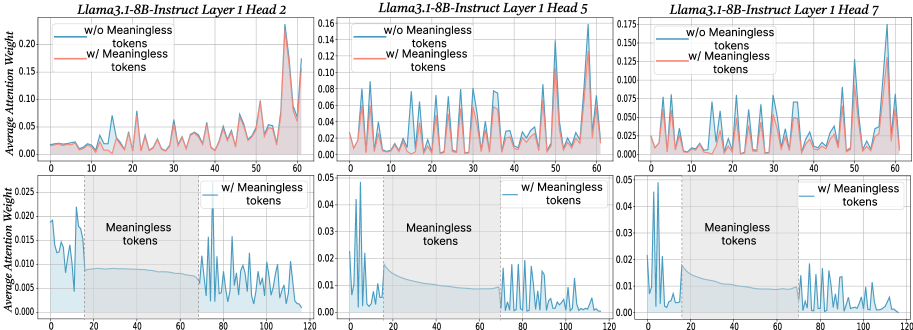
The image contains six line graphs arranged in a 2x3 grid. Each graph displays the average attention weight of a language model (Llama3.1-8B-Instruct) across different tokens. The top row shows attention weights for the first 60 tokens, while the bottom row shows attention weights for the first 120 tokens. The graphs compare attention weights when "meaningless tokens" are included versus when they are excluded. The three columns represent different attention heads (Head 2, Head 5, and Head 7) within the same layer (Layer 1) of the model.
### Components/Axes
* **Titles:** Each graph has a title in the format "Llama3.1-8B-Instruct Layer 1 Head [Number]". The titles are located at the top of each graph.
* **Y-axis:** The y-axis is labeled "Average Attention Weight". The scale varies slightly between the top and bottom rows.
* Top row: Ranges from 0.00 to approximately 0.20 (Head 2), 0.16 (Head 5), and 0.175 (Head 7).
* Bottom row: Ranges from 0.000 to 0.025 (Head 2), 0.05 (Head 5), and 0.05 (Head 7).
* **X-axis:** The x-axis represents the token index.
* Top row: Ranges from 0 to 60.
* Bottom row: Ranges from 0 to 120.
* **Legend:** Each graph in the top row has a legend in the top-left corner:
* Blue line: "w/o Meaningless tokens" (without Meaningless tokens)
* Red line: "w/ Meaningless tokens" (with Meaningless tokens)
* **Shaded Region:** The bottom row graphs have a shaded gray region labeled "Meaningless tokens" spanning approximately from token index 20 to 80.
* **Vertical Dotted Lines:** The bottom row graphs have vertical dotted lines at approximately token index 20 and 80, marking the boundaries of the "Meaningless tokens" region.
### Detailed Analysis
**Llama3.1-8B-Instruct Layer 1 Head 2**
* **Top Graph:**
* Blue line (w/o Meaningless tokens): Fluctuates between approximately 0.00 and 0.10, with some peaks reaching around 0.12.
* Red line (w/ Meaningless tokens): Generally follows the blue line but has higher peaks, reaching up to approximately 0.18 around token index 55. The red line is generally above the blue line.
* **Bottom Graph:**
* Blue line (w/ Meaningless tokens): Starts around 0.015, decreases to approximately 0.008 within the "Meaningless tokens" region, and then fluctuates between 0.005 and 0.025 after token index 80.
**Llama3.1-8B-Instruct Layer 1 Head 5**
* **Top Graph:**
* Blue line (w/o Meaningless tokens): Fluctuates between approximately 0.00 and 0.10, with several sharp peaks.
* Red line (w/ Meaningless tokens): Generally follows the blue line, but the peaks are slightly lower.
* **Bottom Graph:**
* Blue line (w/ Meaningless tokens): Starts around 0.04, decreases to approximately 0.01 within the "Meaningless tokens" region, and then fluctuates between 0.005 and 0.04 after token index 80.
**Llama3.1-8B-Instruct Layer 1 Head 7**
* **Top Graph:**
* Blue line (w/o Meaningless tokens): Fluctuates between approximately 0.00 and 0.12, with some peaks reaching around 0.15.
* Red line (w/ Meaningless tokens): Generally follows the blue line, but the peaks are slightly lower.
* **Bottom Graph:**
* Blue line (w/ Meaningless tokens): Starts around 0.045, decreases to approximately 0.01 within the "Meaningless tokens" region, and then fluctuates between 0.005 and 0.03 after token index 80.
### Key Observations
* The inclusion of "meaningless tokens" generally increases the average attention weight in the top row graphs, especially for Head 2.
* In the bottom row graphs, the average attention weight is significantly lower within the "Meaningless tokens" region (token indices 20-80) compared to the regions before and after.
* The attention weights fluctuate more sharply in the top row graphs compared to the bottom row graphs.
* The y-axis scales are different between the top and bottom rows, indicating that the average attention weights are generally lower when considering the full sequence of 120 tokens (bottom row) compared to the first 60 tokens (top row).
### Interpretation
The data suggests that "meaningless tokens" have a varying impact on the attention weights of different heads within the language model. For Head 2, including "meaningless tokens" leads to a noticeable increase in attention weight, particularly towards the end of the sequence. However, for Heads 5 and 7, the effect is less pronounced.
The lower attention weights within the "Meaningless tokens" region in the bottom row graphs indicate that the model pays less attention to these tokens, which is expected given their nature. The model seems to focus more on the meaningful tokens outside this region.
The differences in attention patterns across different heads highlight the diverse roles that individual attention heads play in processing the input sequence. Some heads may be more sensitive to the presence of "meaningless tokens" than others.