TECHNICAL ASSET FINGERPRINT
e5b62f9968ead6671e90fd33
Click to view fullscreen
Press ESC or click to close
FOUND IN PAPERS
EXPERT: healer-alpha-free VERSION 1
RUNTIME: free/openrouter/healer-alpha
INTEL_VERIFIED
## Line Charts: Attention Weight Analysis for Llama3.1-8B-Instruct
### Overview
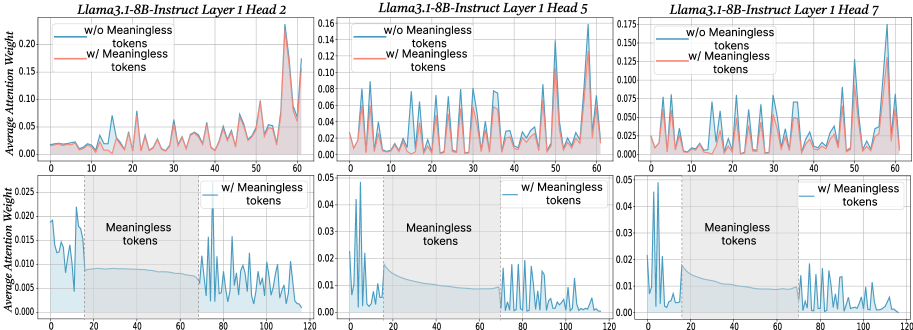
The image displays a 2x3 grid of six line charts analyzing "Average Attention Weight" across token positions for different attention heads in the first layer of the Llama3.1-8B-Instruct model. The top row compares model behavior with and without "meaningless tokens," while the bottom row focuses exclusively on the condition with meaningless tokens, highlighting the specific segment where they appear.
### Components/Axes
* **Titles:** Each column is titled by model, layer, and head:
* Left Column: `Llama3.1-8B-Instruct Layer 1 Head 2`
* Middle Column: `Llama3.1-8B-Instruct Layer 1 Head 5`
* Right Column: `Llama3.1-8B-Instruct Layer 1 Head 7`
* **Y-Axis (All Charts):** Labeled `Average Attention Weight`. The scale varies per chart.
* **X-Axis (All Charts):** Represents token position index.
* Top Row Charts: Range from 0 to 60.
* Bottom Row Charts: Range from 0 to 120.
* **Legends:**
* **Top Row Charts:** Contain a legend in the top-left corner.
* Blue Line: `w/o Meaningless tokens`
* Red Line: `w/ Meaningless tokens`
* **Bottom Row Charts:** Contain a legend in the top-right corner.
* Blue Line: `w/ Meaningless tokens`
* **Annotations:**
* **Bottom Row Charts:** A shaded gray region spans approximately from token position 20 to 70. This region is labeled with the text `Meaningless tokens` centered within it.
### Detailed Analysis
**Top Row (Comparison of Conditions):**
* **Head 2 (Left):**
* Y-axis scale: 0.00 to 0.20.
* **Trend (w/o Meaningless - Blue):** Shows high variability with several sharp peaks. Notable peaks occur near token positions ~10 (≈0.07), ~30 (≈0.08), and a major peak at ~60 (≈0.18).
* **Trend (w/ Meaningless - Red):** Generally lower and smoother than the blue line. It has smaller, more frequent oscillations. Its highest point is near token position 60 (≈0.16), slightly below the blue peak.
* **Head 5 (Middle):**
* Y-axis scale: 0.00 to 0.16.
* **Trend (w/o Meaningless - Blue):** Exhibits a pattern of regular, sharp peaks of similar height (≈0.08-0.10) across the sequence, with a final, higher peak near position 60 (≈0.15).
* **Trend (w/ Meaningless - Red):** Follows a similar rhythmic pattern to the blue line but with consistently lower amplitude. Peaks are dampened, generally staying below 0.08.
* **Head 7 (Right):**
* Y-axis scale: 0.000 to 0.175.
* **Trend (w/o Meaningless - Blue):** Shows a series of peaks that increase in magnitude towards the end of the sequence, culminating in a very high peak near position 60 (≈0.17).
* **Trend (w/ Meaningless - Red):** Again, mirrors the blue line's pattern but with reduced intensity. Its final peak near position 60 is notably lower (≈0.12).
**Bottom Row (Focus on Meaningless Token Segment):**
* **Head 2 (Left):**
* Y-axis scale: 0.000 to 0.025.
* **Trend:** Attention weight is highest at the very beginning (positions 0-10, peaking near 0.020). It drops sharply upon entering the `Meaningless tokens` region (positions ~20-70), remaining very low and flat (≈0.008-0.010). After the region (positions >70), attention becomes highly variable again with multiple sharp peaks.
* **Head 5 (Middle):**
* Y-axis scale: 0.00 to 0.05.
* **Trend:** Similar pattern. High initial attention (peak ≈0.045). A steep decline occurs at the start of the `Meaningless tokens` region, followed by a low, gradually decaying plateau. Post-region attention (>70) resumes a pattern of sharp, regular peaks.
* **Head 7 (Right):**
* Y-axis scale: 0.00 to 0.05.
* **Trend:** Consistent with the other heads. High initial peak (≈0.045), a drop into the `Meaningless tokens` region where attention is minimal and decaying, followed by a return to high-variance, peaked attention after position 70.
### Key Observations
1. **Consistent Dampening Effect:** Across all three heads (2, 5, 7), the presence of meaningless tokens (`w/ Meaningless tokens` condition, red line in top row) consistently reduces the magnitude and variability of attention weights compared to the condition without them (`w/o Meaningless tokens`, blue line).
2. **Pattern Preservation:** While amplitude is reduced, the fundamental rhythmic pattern or timing of attention peaks is largely preserved between the two conditions in the top row charts.
3. **Attention Suppression in Meaningless Segment:** The bottom row charts explicitly show that attention weights drop to a low, stable baseline specifically within the segment containing meaningless tokens (positions ~20-70).
4. **Variable Y-Axis Scales:** The vertical scales differ between charts (e.g., Head 2 top: 0.20, Head 5 top: 0.16, Head 2 bottom: 0.025). This must be considered when comparing absolute values across different panels.
5. **Legend Inconsistency:** The color coding for the `w/ Meaningless tokens` condition is **red** in the top-row comparison charts but **blue** in the bottom-row detail charts. This is a critical labeling inconsistency to note.
### Interpretation
This visualization provides a technical investigation into how a large language model's attention mechanism processes sequences containing semantically void or "meaningless" tokens.
* **Core Finding:** The data strongly suggests that meaningless tokens act as an attention sink or dampener. When present, they cause the model to allocate less focused attention (lower average weights) across the entire sequence, not just locally to the meaningless tokens themselves. This is evidenced by the globally lower red lines in the top row.
* **Mechanism Insight:** The bottom row reveals the local mechanism: attention is actively suppressed *during* the meaningless token segment. The model appears to "ignore" this segment, resulting in a low, flat attention profile. The subsequent return to high-variance attention after the segment indicates the model re-engages with meaningful content.
* **Implication for Model Behavior:** This behavior could be a model's learned strategy for maintaining efficiency or robustness. By reducing attention to non-informative tokens, the model may preserve its capacity for processing meaningful information. However, the global dampening effect also suggests that the presence of such tokens might slightly degrade the model's ability to form strong, selective attention patterns on the meaningful parts of the input.
* **Cross-Head Consistency:** The effect is observed across multiple attention heads (2, 5, 7) in Layer 1, indicating it is not an isolated phenomenon but a more general response characteristic of this model layer to meaningless input.
DECODING INTELLIGENCE...