## Line Chart: Llama3.1-8B-Instruct Layer 1 Head Attention Weights
### Overview
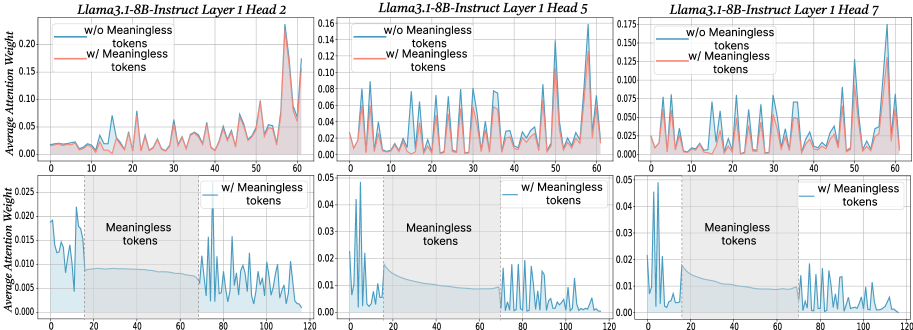
The image contains three line charts comparing average attention weights across token positions (0-120) for three attention heads (Head 2, Head 5, Head 7) in Layer 1 of the Llama3.1-8B-Instruct model. Each chart compares two scenarios: attention weights **with** and **without** meaningless tokens. The charts use blue (dashed) and red (solid) lines to represent these scenarios, with shaded regions highlighting token ranges.
---
### Components/Axes
- **X-axis**: Token positions (0–120), labeled "Token Position".
- **Y-axis**: Average attention weight (0.00–0.20), labeled "Average Attention Weight".
- **Legends**:
- **Blue (dashed)**: "w/o Meaningless tokens" (no meaningless tokens).
- **Red (solid)**: "w/ Meaningless tokens" (with meaningless tokens).
- **Shaded Regions**: Gray areas labeled "Meaningless tokens" span token positions 20–80 in all charts.
---
### Detailed Analysis
#### Head 2
- **w/o Meaningless tokens (blue)**:
- Stable baseline (~0.05) with minor fluctuations.
- Peaks at ~0.10 near token 60.
- **w/ Meaningless tokens (red)**:
- Higher baseline (~0.07) with sharper peaks.
- Sharp spike to ~0.15 at token 60.
- **Shaded Region**: Blue line dips slightly (~0.04) within 20–80 tokens.
#### Head 5
- **w/o Meaningless tokens (blue)**:
- Baseline ~0.06 with moderate fluctuations.
- Peaks at ~0.12 near token 60.
- **w/ Meaningless tokens (red)**:
- Baseline ~0.08 with more pronounced peaks.
- Spike to ~0.14 at token 60.
- **Shaded Region**: Blue line remains stable (~0.06) within 20–80 tokens.
#### Head 7
- **w/o Meaningless tokens (blue)**:
- Baseline ~0.07 with minor fluctuations.
- Peaks at ~0.13 near token 60.
- **w/ Meaningless tokens (red)**:
- Baseline ~0.09 with sharper peaks.
- Spike to ~0.16 at token 60.
- **Shaded Region**: Blue line dips slightly (~0.06) within 20–80 tokens.
---
### Key Observations
1. **Consistent Peaks**: All three heads show significant attention spikes (~0.10–0.16) at token 60 when meaningless tokens are included.
2. **Baseline Differences**: Attention weights are consistently higher (0.02–0.04) in the "w/ Meaningless tokens" scenario across all heads.
3. **Shaded Region Behavior**:
- Blue lines (no meaningless tokens) show minor dips (~0.04–0.06) within the 20–80 token range.
- Red lines (with tokens) maintain elevated attention weights (~0.07–0.09) in this region.
---
### Interpretation
The data suggests that the inclusion of meaningless tokens increases attention weights in specific regions (e.g., token 60), potentially indicating the model's effort to process or filter irrelevant information. The shaded region (20–80 tokens) may represent a critical zone where attention dynamics differ significantly between scenarios. The consistent pattern across all three heads implies this behavior is a general property of Layer 1 in the model, rather than head-specific. The spikes at token 60 could correspond to syntactic or semantic boundaries in the input sequence, warranting further investigation into how meaningless tokens disrupt or modulate attention mechanisms.