# Technical Document Extraction: 2D Dimensionality Reduction Scatter Plot
## 1. Component Isolation
* **Header:** None.
* **Main Chart Area:** A scatter plot containing approximately 300-400 data points distributed across a 2D coordinate system.
* **Legend:** Located in the upper right quadrant (approximate spatial grounding: [x=0.7, y=0.8] in normalized coordinates).
* **Axes:** Numerical scales on both the X and Y axes.
## 2. Axis and Legend Extraction
### Axis Labels and Markers
* **X-Axis (Horizontal):** Unlabeled. Numerical markers at intervals of 10: `[-20, -10, 0, 10, 20, 30]`.
* **Y-Axis (Vertical):** Unlabeled. Numerical markers at intervals of 10: `[-20, -10, 0, 10, 20, 30]`.
### Legend Data
The legend identifies three distinct categories represented by colored circular markers with partial transparency (alpha blending):
| Color | Label | Description |
| :--- | :--- | :--- |
| **Green** | `Factual Asso.` | Likely "Factual Association" |
| **Blue** | `Asso. Hallu.` | Likely "Associative Hallucination" |
| **Red** | `Unasso. Hallu.` | Likely "Unassociated Hallucination" |
---
## 3. Data Distribution and Trend Analysis
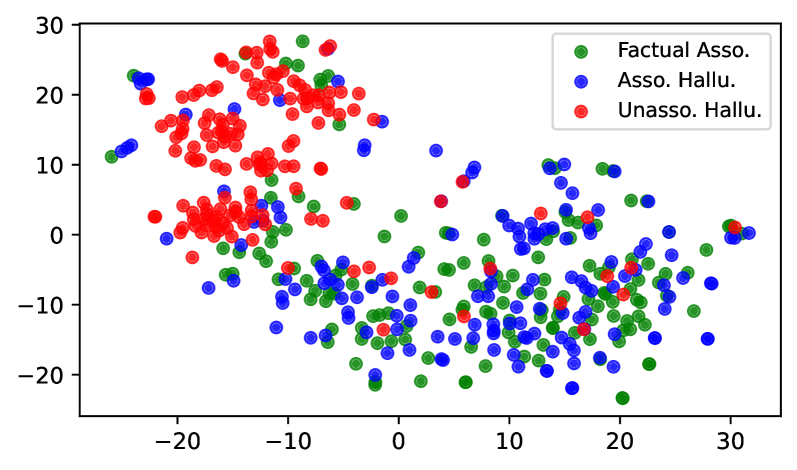
The image is a dimensionality reduction plot (such as t-SNE or UMAP), used to visualize high-dimensional data in 2D space. The spatial proximity of points indicates similarity.
### Category 1: Unasso. Hallu. (Red)
* **Visual Trend:** This category shows the highest degree of clustering and separation from the other two groups.
* **Spatial Placement:**
* **Primary Cluster:** A dense concentration located in the upper-left quadrant, specifically between X: [-20, -5] and Y: [10, 28].
* **Secondary Cluster:** A very tight, dense cluster located at X: [-18, -12] and Y: [0, 5].
* **Outliers:** Very few red points are scattered in the lower-right quadrant, indicating this category is distinct from the others.
### Category 2: Factual Asso. (Green)
* **Visual Trend:** This category is highly dispersed and shows significant overlap with the "Asso. Hallu." (Blue) group.
* **Spatial Placement:**
* **Primary Concentration:** Distributed across the bottom half of the plot, primarily between X: [-10, 30] and Y: [-25, 5].
* **Secondary Presence:** A small number of points are mixed within the upper-left red cluster (around X: -10, Y: 25).
* **Observation:** The green points form a "cloud" that defines the lower-right region of the latent space.
### Category 3: Asso. Hallu. (Blue)
* **Visual Trend:** Similar to the green points, these are widely dispersed and lack a single tight cluster. They appear "intermingled" with the factual data.
* **Spatial Placement:**
* **Primary Concentration:** Heavily overlapping with the green points in the lower-right region (X: [-5, 30], Y: [-20, 10]).
* **Bridge Points:** Several blue points act as "bridges" or outliers between the main lower-right cloud and the upper-left red clusters (e.g., points at X: -25, Y: 12 and X: -5, Y: 15).
---
## 4. Summary of Findings
The plot demonstrates a clear separation between **Unassociated Hallucinations (Red)** and the other two categories. The Red data points occupy a distinct region of the vector space, suggesting they have unique characteristics or features.
Conversely, **Factual Associations (Green)** and **Associative Hallucinations (Blue)** are spatially co-located. This indicates that, within the context of this model's representation, factual information and associative hallucinations are mathematically similar and difficult to distinguish based solely on their position in this 2D projection.