\n
## Scatter Plot: Association Analysis
### Overview
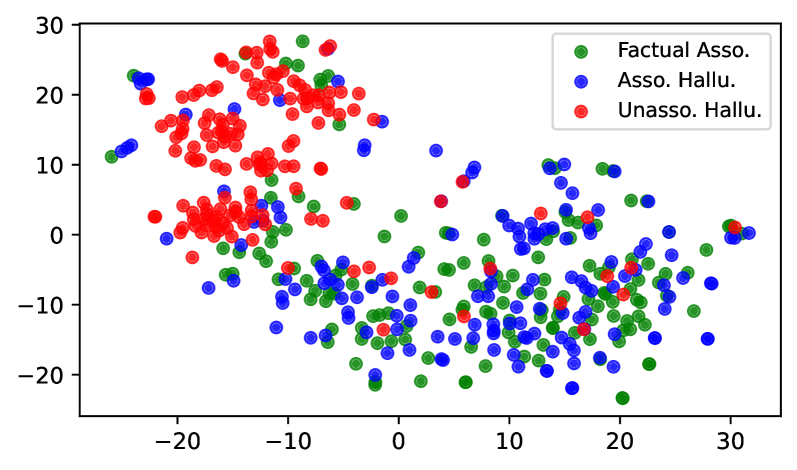
The image presents a scatter plot visualizing the distribution of three categories of associations: "Factual Association", "Association Hallucination", and "Unassociated Hallucination". The plot displays these associations across two dimensions, represented by the x and y axes, with values ranging approximately from -25 to 35. The data points are color-coded according to their category, as indicated by the legend in the top-right corner.
### Components/Axes
* **X-axis:** Ranges from approximately -25 to 35. No explicit label is provided.
* **Y-axis:** Ranges from approximately -25 to 30. No explicit label is provided.
* **Legend:** Located in the top-right corner.
* Green: "Factual Asso." (Factual Association)
* Blue: "Asso. Hallu." (Association Hallucination)
* Red: "Unasso. Hallu." (Unassociated Hallucination)
### Detailed Analysis
The plot contains a large number of data points for each category.
* **Factual Association (Green):** The green data points are scattered throughout the plot, with a concentration in the lower-right quadrant (positive x-values, negative y-values) and a smaller cluster in the upper-left quadrant (negative x-values, positive y-values). Values appear to range from approximately x = -5 to x = 25, and y = -15 to y = 20.
* **Association Hallucination (Blue):** The blue data points are more densely concentrated in the lower-left quadrant (negative x and y values) and show a moderate spread across the plot. Values appear to range from approximately x = -20 to x = 30, and y = -20 to y = 10.
* **Unassociated Hallucination (Red):** The red data points are heavily concentrated in the upper-left quadrant (negative x-values, positive y-values) and show a moderate spread. Values appear to range from approximately x = -25 to x = 15, and y = 0 to y = 25.
**Trend Verification:**
* The green points do not exhibit a clear linear trend, but show a tendency to cluster in the lower-right.
* The blue points show a slight upward trend from left to right, but are largely scattered.
* The red points show a concentration in the upper-left, with a downward trend as x increases.
### Key Observations
* The "Unassociated Hallucination" (red) category exhibits the highest concentration of points in the upper-left quadrant, suggesting a strong association between negative x-values and positive y-values for this category.
* The "Association Hallucination" (blue) category is more evenly distributed, but leans towards negative x and y values.
* The "Factual Association" (green) category shows a more dispersed pattern, with points across a wider range of x and y values.
* There is significant overlap between all three categories, indicating that the two dimensions do not perfectly separate the associations.
### Interpretation
This scatter plot likely represents a dimensionality reduction of some higher-dimensional data related to associations. The x and y axes represent the reduced dimensions, and the color-coding indicates the type of association. The plot suggests that "Unassociated Hallucinations" are distinct from "Factual Associations" in this reduced space, as they cluster in a different region. "Association Hallucinations" appear to be intermediate, overlapping with both other categories.
The lack of explicit axis labels makes it difficult to interpret the meaning of the x and y dimensions. However, the plot suggests that these dimensions capture some underlying structure in the data that differentiates between factual associations and different types of hallucinations. The overlap between categories indicates that the dimensions are not perfect predictors of association type.
The plot could be used to evaluate the performance of an association learning model, where the goal is to identify factual associations and distinguish them from hallucinations. The distribution of points could reveal biases or weaknesses in the model. For example, if the model tends to misclassify "Factual Associations" as "Association Hallucinations", this would be reflected in an overlap between the green and blue clusters.