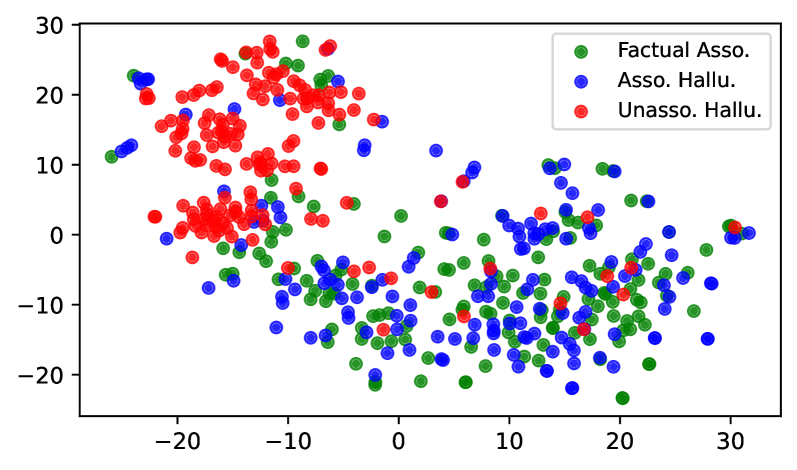
## Scatter Plot of Categorical Data Points
### Overview
The image is a 2D scatter plot displaying data points categorized into three distinct groups, differentiated by color. The plot visualizes the spatial distribution and clustering of these categories across a Cartesian coordinate system. No specific axis titles are provided, indicating the data is likely projected into an abstract or reduced-dimensional space (e.g., from a technique like PCA or t-SNE).
### Components/Axes
* **Legend:** Located in the top-right corner of the plot area. It contains three entries:
* **Green Circle:** Labeled "Factual Asso."
* **Blue Circle:** Labeled "Asso. Hallu."
* **Red Circle:** Labeled "Unasso. Hallu."
* **X-Axis:** A horizontal numerical axis. Major tick marks and labels are present at intervals of 10, ranging from **-20** to **30**. The visible labels are: -20, -10, 0, 10, 20, 30.
* **Y-Axis:** A vertical numerical axis. Major tick marks and labels are present at intervals of 10, ranging from **-20** to **30**. The visible labels are: -20, -10, 0, 10, 20, 30.
* **Plot Area:** A white background containing all data points. The axes form a bounding box around the data.
### Detailed Analysis
The data points are distributed with clear spatial segregation based on category:
1. **Unasso. Hallu. (Red Points):**
* **Spatial Grounding:** Primarily clustered in the **top-left quadrant** of the plot.
* **Trend & Distribution:** Forms a dense, roughly elliptical cluster. The center of mass appears to be around coordinates **(-10, 15)**. The cluster spans approximately from X = -25 to X = 0 and Y = 0 to Y = 30. This group shows the most distinct separation from the others.
2. **Asso. Hallu. (Blue Points):**
* **Spatial Grounding:** Predominantly located in the **bottom half and right side** of the plot.
* **Trend & Distribution:** Exhibits a more dispersed, elongated distribution. Points are scattered from approximately X = -25 to X = 30 and Y = -20 to Y = 15. There is a noticeable concentration in the **bottom-right quadrant** (X > 0, Y < 0). This group significantly overlaps with the green points.
3. **Factual Asso. (Green Points):**
* **Spatial Grounding:** Intermixed with the blue points, primarily in the **bottom-center and bottom-right** regions.
* **Trend & Distribution:** Also shows a dispersed distribution, similar in range to the blue points (X: -20 to 30, Y: -20 to 10). The highest density appears in the region around **X = 0 to 20, Y = -15 to 0**. There is substantial spatial overlap with the "Asso. Hallu." (blue) category.
### Key Observations
* **Clear Cluster Separation:** The "Unasso. Hallu." (red) category forms a tight, isolated cluster in the upper-left, distinct from the other two groups.
* **Significant Overlap:** The "Asso. Hallu." (blue) and "Factual Asso." (green) categories are heavily intermingled across the lower and right portions of the plot, suggesting they share similar characteristics in this projected space.
* **Density Variation:** The red cluster appears denser than the more scattered blue and green point distributions.
* **Absence of Outliers:** There are no extreme outliers far removed from their respective group's general distribution.
### Interpretation
This scatter plot likely visualizes the output of a dimensionality reduction technique applied to data related to language model outputs or knowledge associations, given the labels ("Asso." for Association, "Hallu." for Hallucination).
* **What the data suggests:** The spatial separation implies that the underlying features used for projection can effectively distinguish "Unassociated Hallucinations" (red) from the other two categories. The significant overlap between "Associated Hallucinations" (blue) and "Factual Associations" (green) indicates that, in this feature space, these two phenomena are not easily separable. This could mean they share similar statistical or semantic properties, or that the model's internal representations for factual knowledge and associated hallucinations are closely aligned.
* **How elements relate:** The plot demonstrates a potential hierarchy or relationship. "Unassociated Hallucinations" appear as a distinct outlier class. The core challenge highlighted is the ambiguity between "Associated Hallucinations" and correct "Factual Associations," as they occupy a similar region in the latent space. This visualizes the difficulty a model might have in distinguishing between a fact it knows and a plausible-sounding but incorrect association it generates.
* **Notable Anomalies:** The primary anomaly is the stark isolation of the red cluster. The lack of axis titles is a critical limitation, as the meaning of the dimensions (e.g., "semantic similarity," "confidence score," "embedding dimension 1") is essential for a full technical interpretation. The data suggests that "Unassociated Hallucinations" may arise from a fundamentally different process or represent a different type of error compared to "Associated Hallucinations."