## Line Chart: MMBench Performance vs. Number of Visual Tokens
### Overview
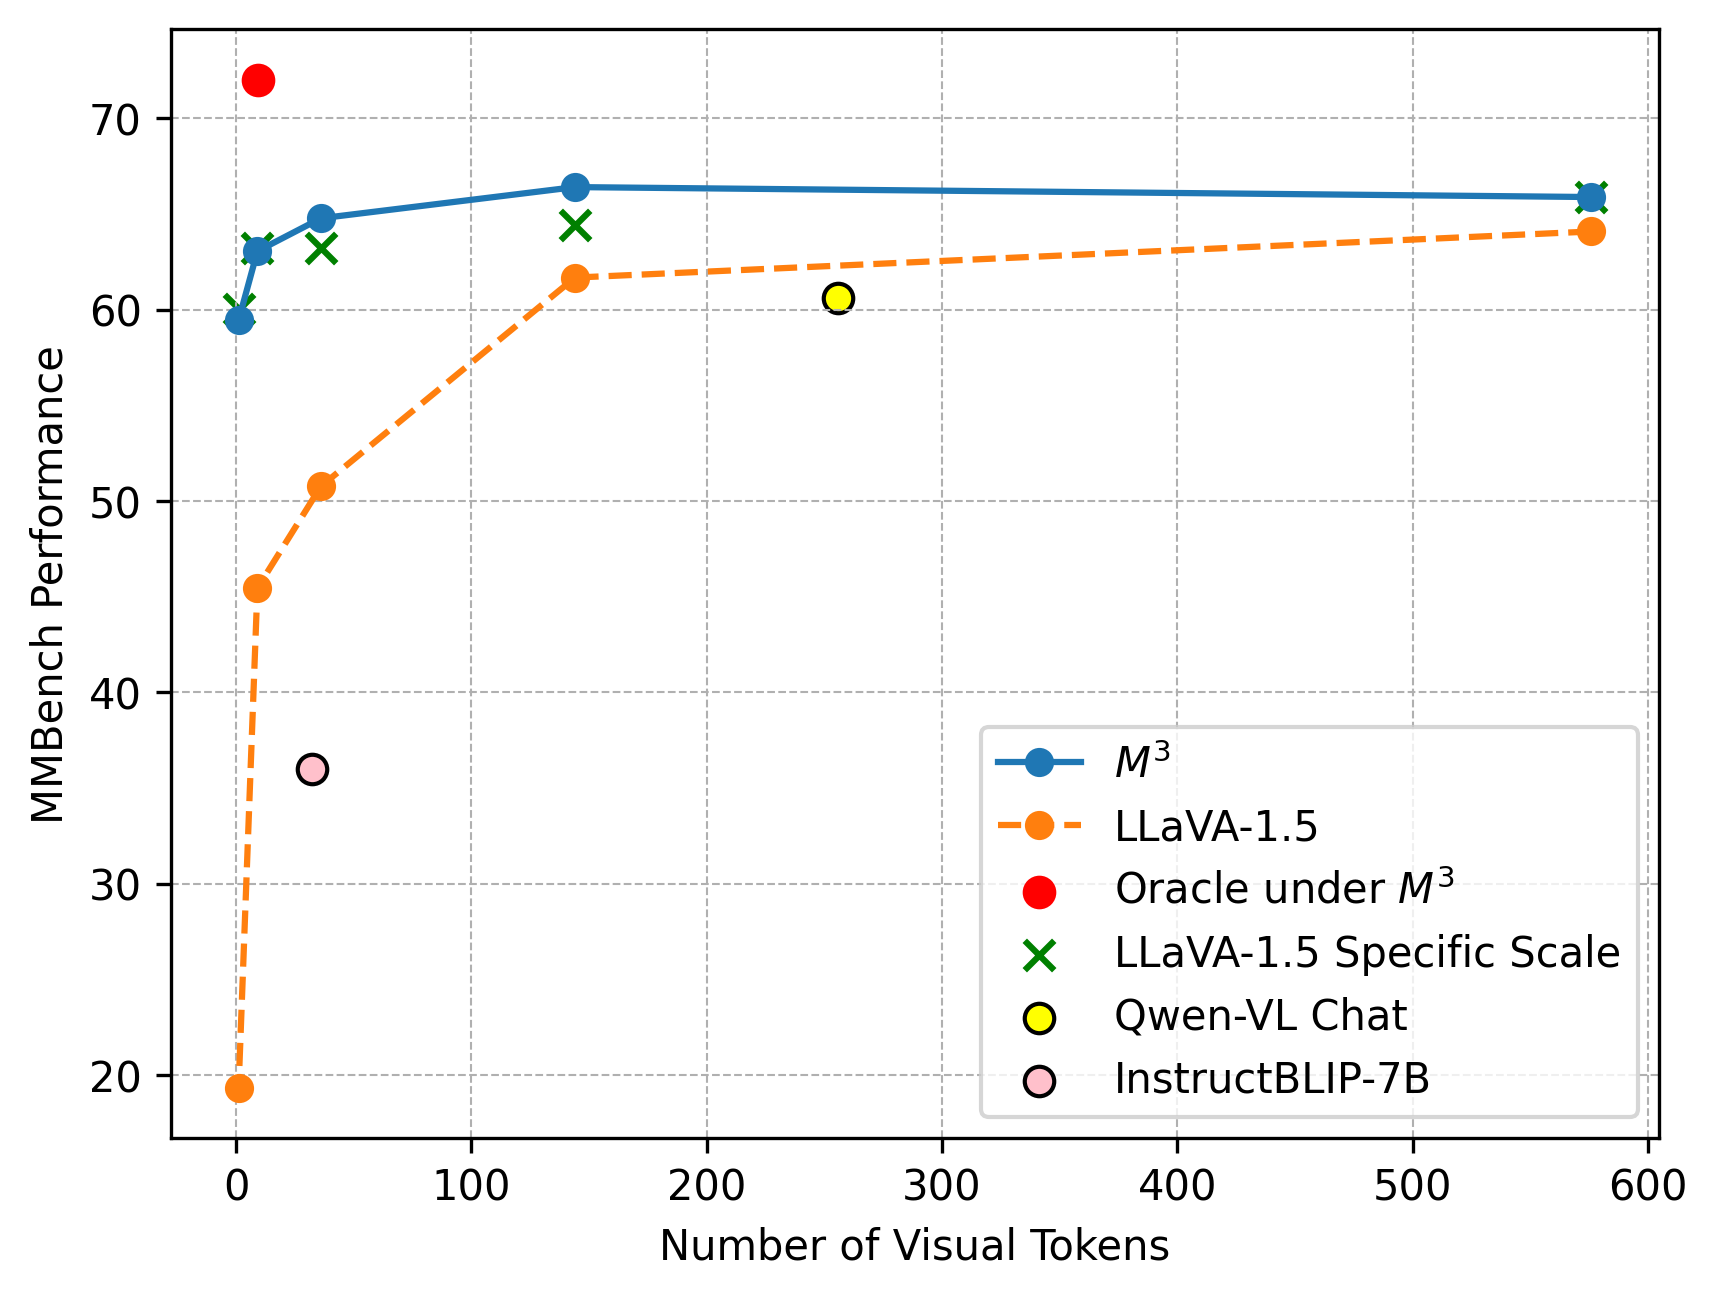
The image is a line chart comparing the MMBench performance of several models (M^3, LLaVA-1.5, Oracle under M^3, LLaVA-1.5 Specific Scale, Qwen-VL Chat, and InstructBLIP-7B) against the number of visual tokens used. The chart shows how performance changes as the number of visual tokens increases.
### Components/Axes
* **X-axis:** Number of Visual Tokens, ranging from 0 to 600, with tick marks at intervals of 100.
* **Y-axis:** MMBench Performance, ranging from 20 to 70, with tick marks at intervals of 10.
* **Legend:** Located in the bottom-right corner, enclosed in a light gray box. The legend identifies each line/data series by color and label:
* Blue line with circle markers: M^3
* Orange dashed line with circle markers: LLaVA-1.5
* Red circle marker: Oracle under M^3
* Green 'X' marker: LLaVA-1.5 Specific Scale
* Yellow circle marker: Qwen-VL Chat
* Pink circle marker: InstructBLIP-7B
### Detailed Analysis
* **M^3 (Blue Line):** The line starts at approximately (0, 60), rises to approximately (20, 63), then to (50, 65), and plateaus around 66 for the rest of the range.
* (0, 60)
* (20, 63)
* (50, 65)
* (580, 66)
* **LLaVA-1.5 (Orange Dashed Line):** The line starts at approximately (0, 20), rises sharply to approximately (20, 46), then to (50, 51), then to (150, 62), and plateaus around 64 for the rest of the range.
* (0, 20)
* (20, 46)
* (50, 51)
* (150, 62)
* (580, 64)
* **Oracle under M^3 (Red Circle):** A single data point at approximately (20, 72).
* **LLaVA-1.5 Specific Scale (Green 'X'):** Two data points: one at approximately (20, 63) and another at approximately (150, 65).
* **Qwen-VL Chat (Yellow Circle):** A single data point at approximately (270, 61).
* **InstructBLIP-7B (Pink Circle):** A single data point at approximately (20, 36).
### Key Observations
* M^3 and LLaVA-1.5 show increasing performance with more visual tokens, but plateau after a certain point.
* Oracle under M^3 has the highest performance but only a single data point.
* LLaVA-1.5 Specific Scale has two data points, showing performance at two different token counts.
* Qwen-VL Chat and InstructBLIP-7B each have a single data point, providing a snapshot of their performance at a specific token count.
### Interpretation
The chart illustrates the relationship between the number of visual tokens and the MMBench performance of different models. It suggests that increasing the number of visual tokens can improve performance up to a certain point, after which the performance plateaus. The "Oracle under M^3" data point indicates a potential upper bound on performance. The different models exhibit varying levels of performance, with M^3 and LLaVA-1.5 showing a clear trend of improvement with more tokens. The single data points for Qwen-VL Chat and InstructBLIP-7B provide a comparison point for their performance relative to the other models.