# Technical Data Extraction: MMBench Performance vs. Visual Tokens
## 1. Metadata and Axis Information
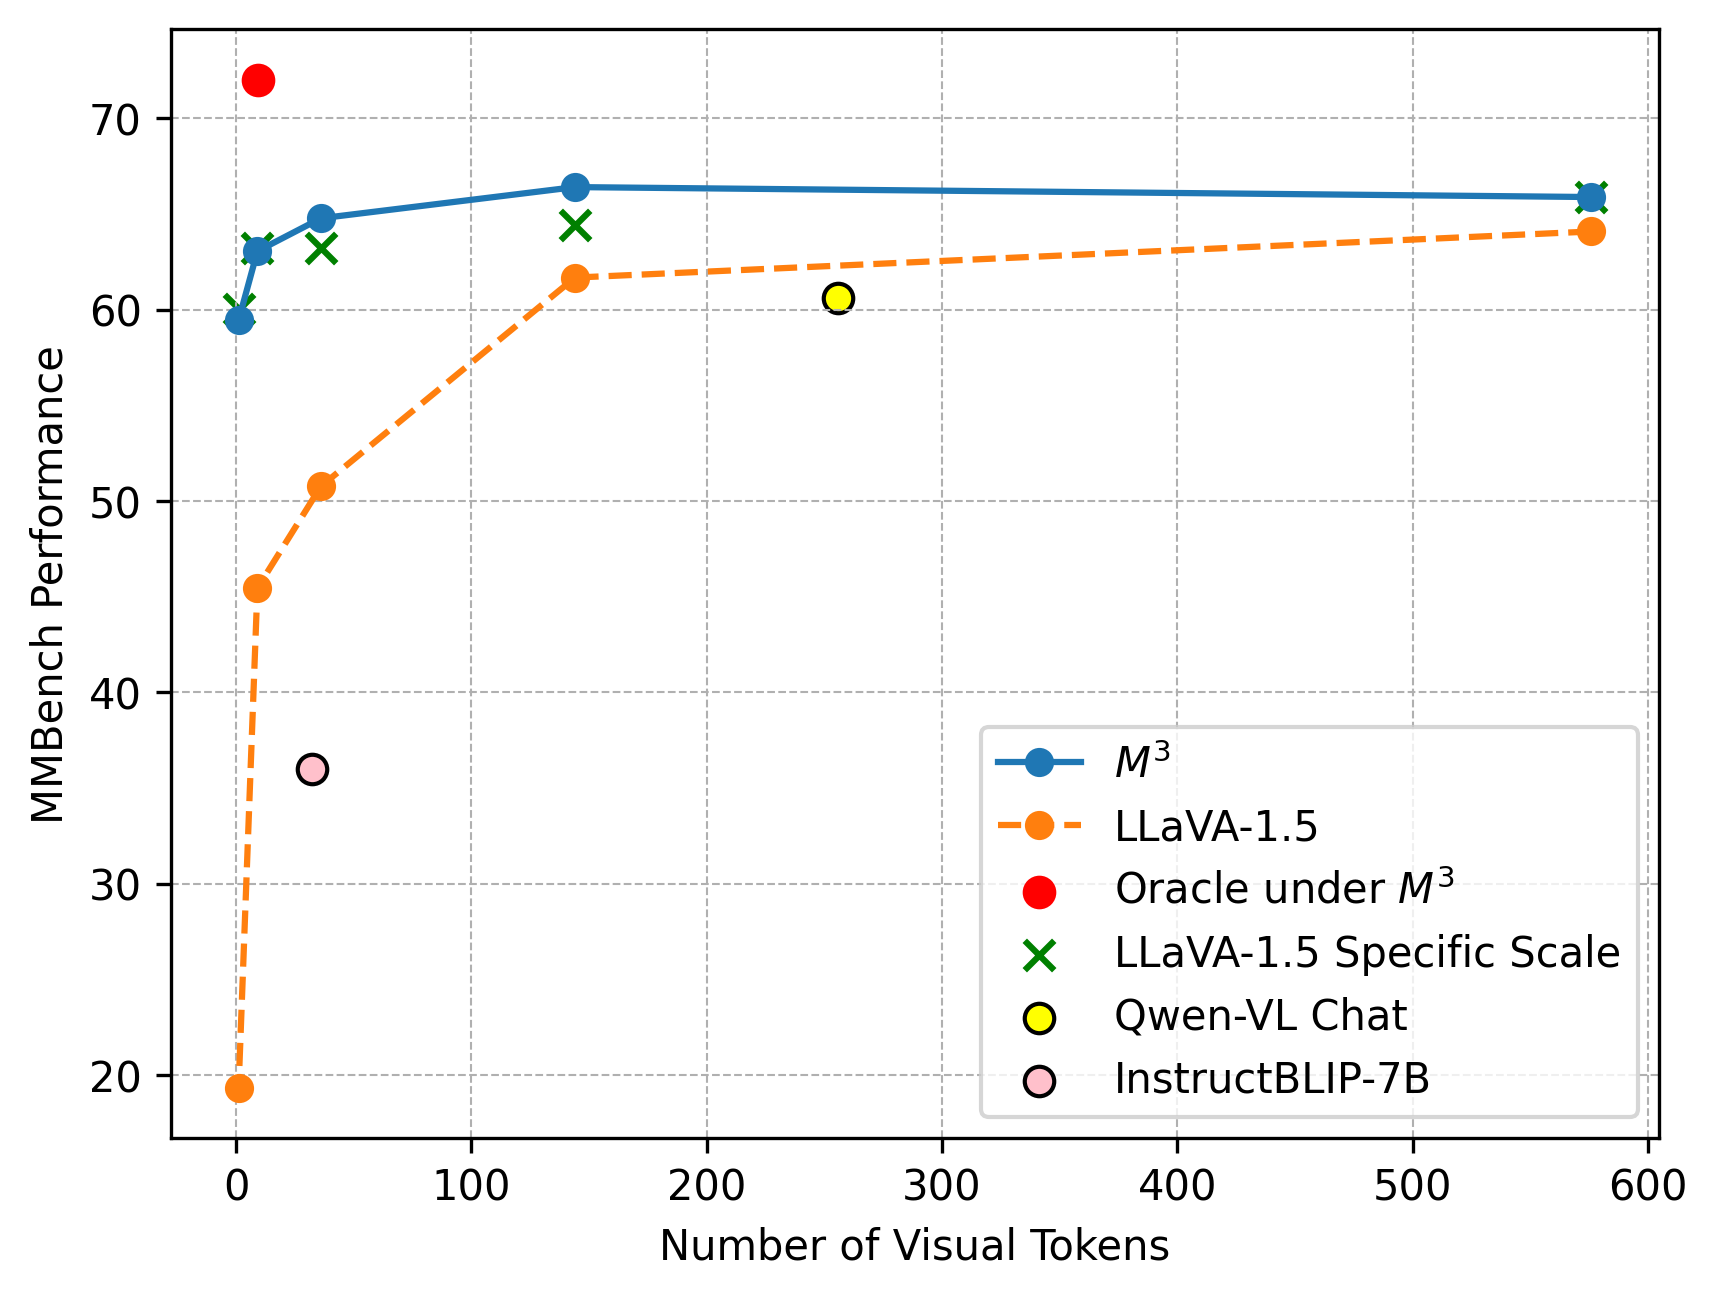
* **Chart Type:** Line and Scatter Plot with a grid background.
* **Y-Axis Title:** MMBench Performance
* **Y-Axis Range:** 20 to 70 (with markers at 20, 30, 40, 50, 60, 70).
* **X-Axis Title:** Number of Visual Tokens
* **X-Axis Range:** 0 to 600 (with markers at 0, 100, 200, 300, 400, 500, 600).
* **Legend Location:** Bottom-right quadrant [approx. x=0.6, y=0.1 to 0.3 relative coordinates].
---
## 2. Legend and Data Series Identification
The legend contains six distinct categories, cross-referenced with the plot markers and lines:
| Legend Label | Marker Style | Line Style | Color |
| :--- | :--- | :--- | :--- |
| **$M^3$** | Solid Circle (●) | Solid Line | Blue |
| **LLaVA-1.5** | Solid Circle (●) | Dashed Line | Orange |
| **Oracle under $M^3$** | Large Solid Circle (●) | N/A (Point) | Red |
| **LLaVA-1.5 Specific Scale** | Cross (✕) | N/A (Points) | Green |
| **Qwen-VL Chat** | Solid Circle with Black Outline (●) | N/A (Point) | Yellow |
| **InstructBLIP-7B** | Solid Circle with Black Outline (●) | N/A (Point) | Pink |
---
## 3. Data Series Analysis and Trends
### Series 1: $M^3$ (Blue Solid Line)
* **Trend:** Rapid initial ascent from 0 to ~40 tokens, followed by a gradual plateauing between 150 and 576 tokens. This series maintains the highest performance among the continuous lines.
* **Data Points (Approximate):**
* (1, 59.5)
* (9, 63.0)
* (36, 65.0)
* (144, 66.5)
* (576, 66.0)
### Series 2: LLaVA-1.5 (Orange Dashed Line)
* **Trend:** Extremely steep initial improvement from 1 to 10 tokens, continuing a steady upward slope until 144 tokens, then tapering to a very slow growth rate toward 576 tokens.
* **Data Points (Approximate):**
* (1, 19.5)
* (9, 45.5)
* (36, 51.0)
* (144, 61.5)
* (576, 64.0)
### Series 3: LLaVA-1.5 Specific Scale (Green Crosses)
* **Trend:** These points track closely with the Blue $M^3$ line, suggesting specific optimized configurations.
* **Data Points (Approximate):**
* (1, 60.5)
* (9, 63.0)
* (36, 63.5)
* (144, 64.5)
* (576, 66.0)
### Series 4: Independent Data Points (Scatter)
* **Oracle under $M^3$ (Red):** Located at approx. (9, 72.0). This is the highest performance point on the chart.
* **Qwen-VL Chat (Yellow):** Located at approx. (256, 60.5).
* **InstructBLIP-7B (Pink):** Located at approx. (32, 36.0).
---
## 4. Comparative Summary
* **Efficiency:** The **$M^3$ (Blue)** model achieves high performance (~60+) with significantly fewer visual tokens compared to the standard **LLaVA-1.5 (Orange)**, which requires over 100 tokens to reach the same performance level.
* **Peak Performance:** The **Oracle under $M^3$** represents the theoretical or upper-bound performance peak at a very low token count (9 tokens).
* **Competitor Comparison:** At approximately 256 tokens, **Qwen-VL Chat** (Yellow) performs lower than both the $M^3$ and LLaVA-1.5 models at that same token scale. **InstructBLIP-7B** (Pink) shows the lowest relative performance for its token count (~36 tokens).