\n
## Line Chart: MMBench Performance vs. Number of Visual Tokens
### Overview
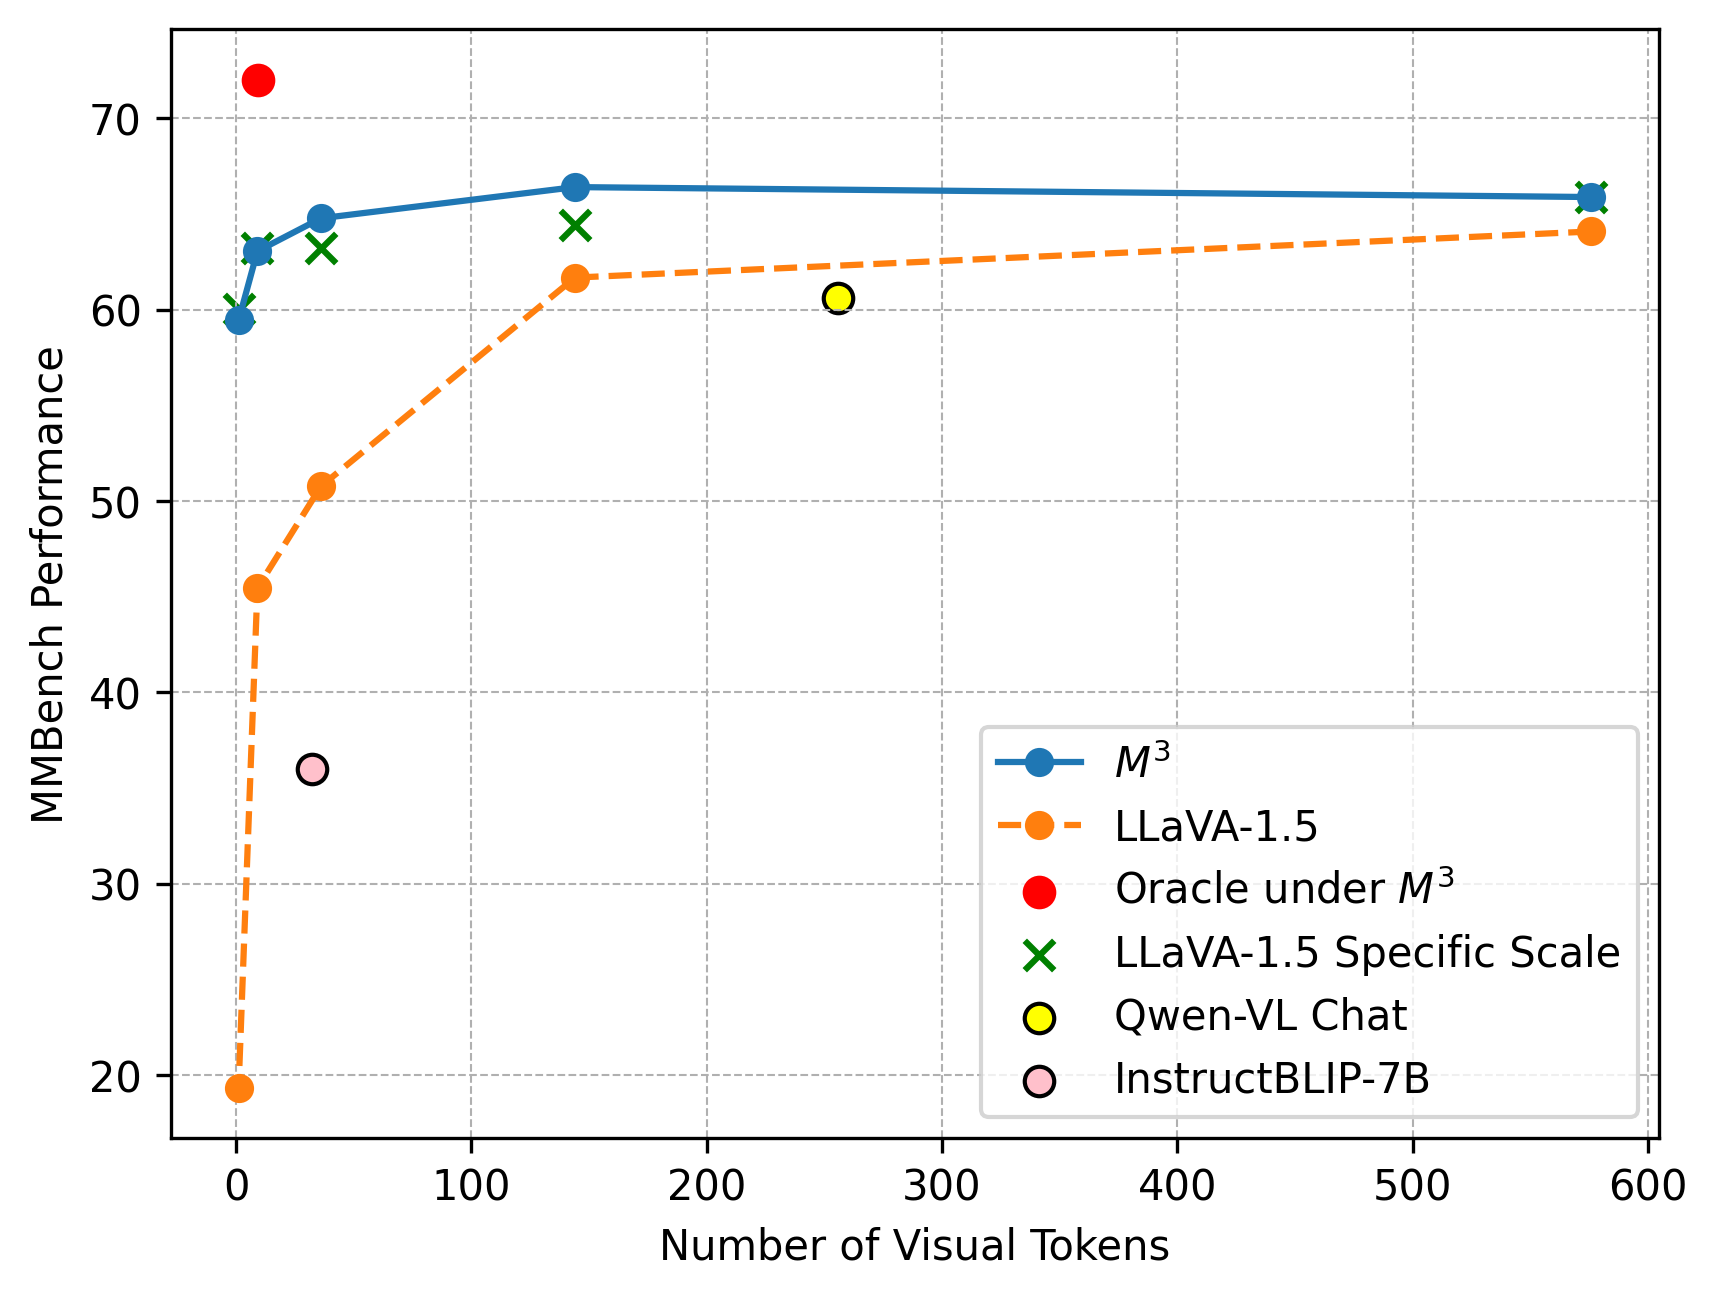
This line chart displays the relationship between MMBench Performance and the Number of Visual Tokens for several different models. The chart shows how performance changes as the number of visual tokens increases.
### Components/Axes
* **X-axis:** Number of Visual Tokens (Scale: 0 to 600, increments of 100)
* **Y-axis:** MMBench Performance (Scale: 20 to 70, increments of 10)
* **Legend:** Located in the bottom-right corner of the chart.
* M³ (Blue line with circle markers)
* LLaVA-1.5 (Orange dashed line with square markers)
* Oracle under M³ (Red solid line with circle markers)
* LLaVA-1.5 Specific Scale (Green solid line with 'x' markers)
* Qwen-VL Chat (Yellow solid line with circle markers)
* InstructBLIP-7B (Purple dashed line with circle markers)
### Detailed Analysis
Here's a breakdown of each data series and their trends:
* **M³ (Blue):** The line starts at approximately 65 at 0 tokens, rises slightly to around 67 at 100 tokens, plateaus around 66-67 from 100 to 600 tokens.
* **LLaVA-1.5 (Orange):** This line shows a steep increase from approximately 21 at 0 tokens to around 62 at 100 tokens. It then plateaus around 62-64 from 100 to 600 tokens.
* **Oracle under M³ (Red):** Starts at approximately 71 at 0 tokens, decreases to around 66 at 100 tokens, and then remains relatively stable around 65-66 from 100 to 600 tokens.
* **LLaVA-1.5 Specific Scale (Green):** Starts at approximately 62 at 0 tokens, rises to around 65 at 100 tokens, and then plateaus around 64-65 from 100 to 600 tokens.
* **Qwen-VL Chat (Yellow):** Starts at approximately 37 at 0 tokens, rises to around 62 at 100 tokens, and then remains relatively stable around 61-63 from 100 to 600 tokens.
* **InstructBLIP-7B (Purple):** Starts at approximately 63 at 0 tokens, decreases to around 62 at 100 tokens, and then remains relatively stable around 62-63 from 100 to 600 tokens.
### Key Observations
* LLaVA-1.5 exhibits the most significant performance increase with an increasing number of visual tokens, showing a rapid improvement from 0 to 100 tokens.
* M³, Oracle under M³, LLaVA-1.5 Specific Scale, Qwen-VL Chat, and InstructBLIP-7B all show relatively stable performance after 100 visual tokens.
* Oracle under M³ starts with the highest performance but experiences a slight decrease as the number of visual tokens increases.
* Qwen-VL Chat starts with the lowest performance but shows a substantial increase with more visual tokens.
### Interpretation
The chart demonstrates the impact of visual tokens on the MMBench performance of different models. The rapid initial gains observed in LLaVA-1.5 and Qwen-VL Chat suggest that these models benefit significantly from processing more visual information. The plateauing performance of other models after 100 tokens indicates that their performance reaches a saturation point, and adding more visual tokens does not yield substantial improvements. The initial high performance of Oracle under M³ followed by a slight decline could indicate that this model is highly optimized for a specific type of visual input or that it struggles with more complex scenes. The data suggests that the number of visual tokens is a crucial factor in determining the performance of these models, particularly for those that initially exhibit lower performance. The differences in performance trajectories highlight the varying capabilities and limitations of each model in handling visual information.