## Scatter Plot with Line Connections: MMBench Performance vs. Number of Visual Tokens
### Overview
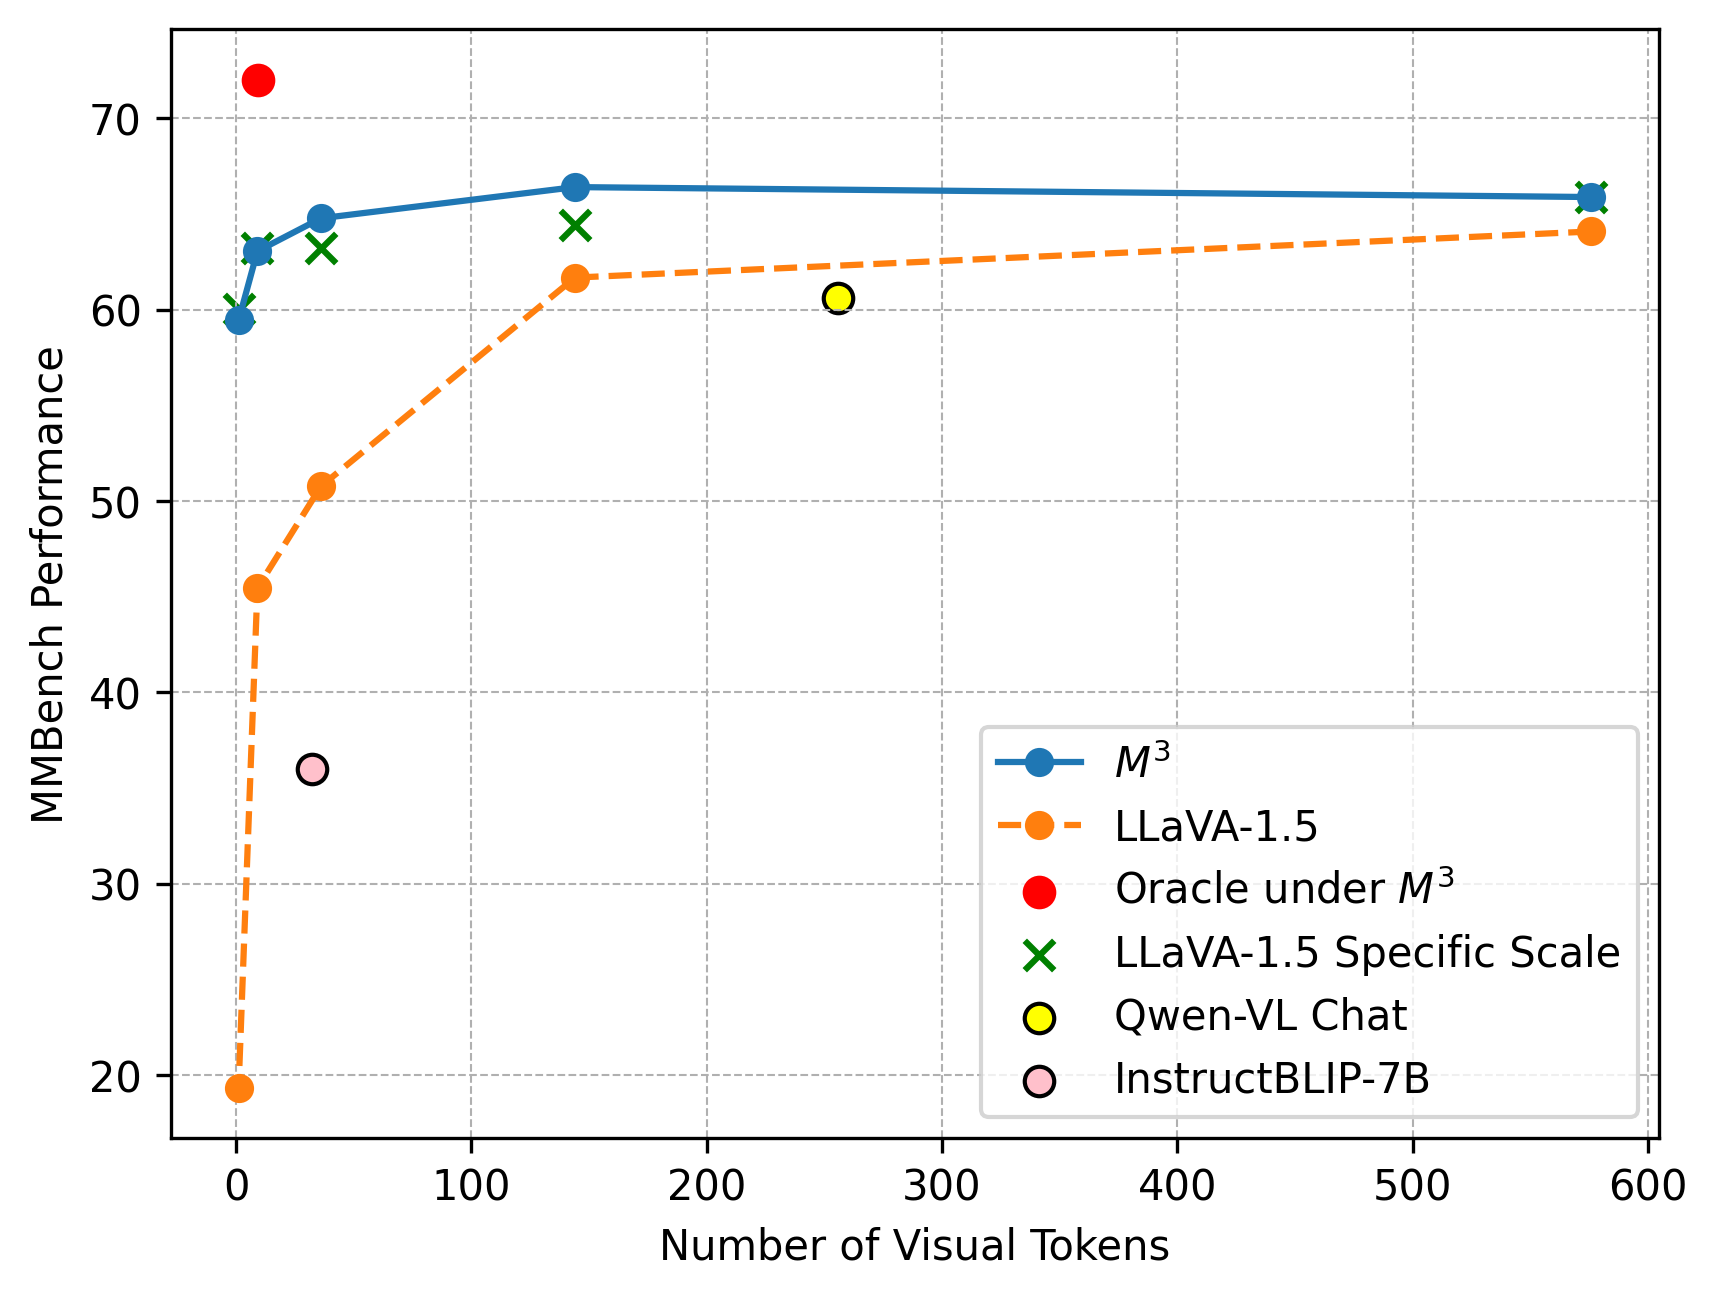
This image is a scatter plot with connected lines for two of the data series, illustrating the relationship between the "Number of Visual Tokens" (x-axis) and "MMBench Performance" (y-axis) for several multimodal AI models. The chart compares the performance scaling of different models as the number of visual tokens increases.
### Components/Axes
* **X-Axis:** Labeled "Number of Visual Tokens". The scale runs from 0 to 600, with major tick marks at 0, 100, 200, 300, 400, 500, and 600.
* **Y-Axis:** Labeled "MMBench Performance". The scale runs from 20 to 70, with major tick marks at 20, 30, 40, 50, 60, and 70.
* **Legend:** Located in the bottom-right quadrant of the chart area. It contains six entries:
1. **M³:** Blue solid line with filled circle markers.
2. **LLaVA-1.5:** Orange dashed line with filled circle markers.
3. **Oracle under M³:** A single red filled circle marker.
4. **LLaVA-1.5 Specific Scale:** Green 'X' markers.
5. **Qwen-VL Chat:** A single yellow filled circle marker with a black outline.
6. **InstructBLIP-7B:** A single pink filled circle marker with a black outline.
### Detailed Analysis
**Data Series and Trends:**
1. **M³ (Blue Line, Circles):**
* **Trend:** The line shows a very steep initial increase in performance as tokens increase from near 0, followed by a rapid plateau. The performance remains nearly constant from approximately 150 tokens onward.
* **Approximate Data Points:**
* At ~0 tokens: Performance ≈ 59.5
* At ~10 tokens: Performance ≈ 63
* At ~30 tokens: Performance ≈ 65
* At ~150 tokens: Performance ≈ 66.5
* At ~580 tokens: Performance ≈ 66
2. **LLaVA-1.5 (Orange Dashed Line, Circles):**
* **Trend:** Similar to M³, it shows a steep initial rise, but starts from a much lower performance baseline. It continues to increase more gradually after the initial jump, showing a slight upward slope even at higher token counts.
* **Approximate Data Points:**
* At ~0 tokens: Performance ≈ 19.5
* At ~5 tokens: Performance ≈ 45.5
* At ~30 tokens: Performance ≈ 50.5
* At ~150 tokens: Performance ≈ 61.5
* At ~580 tokens: Performance ≈ 64
3. **Individual Model Points:**
* **Oracle under M³ (Red Circle):** Positioned at approximately (10, 72). This is the highest performance point on the chart.
* **LLaVA-1.5 Specific Scale (Green 'X's):** Three markers are present.
* One near (10, 60)
* One near (30, 63)
* One near (150, 64.5)
* **Qwen-VL Chat (Yellow Circle):** Positioned at approximately (260, 60.5).
* **InstructBLIP-7B (Pink Circle):** Positioned at approximately (30, 36).
### Key Observations
* **Performance Plateau:** Both the M³ and LLaVA-1.5 models exhibit a clear performance plateau. M³ reaches its near-maximum performance with as few as ~150 visual tokens, while LLaVA-1.5 shows slower gains after the initial steep rise.
* **Model Comparison:** At every comparable token count, the M³ model significantly outperforms LLaVA-1.5. The gap is largest at very low token counts and narrows slightly as tokens increase.
* **Oracle Performance:** The "Oracle under M³" point suggests a theoretical or ideal performance ceiling (~72) that is substantially higher than any achieved by the models shown, even at high token counts.
* **Token Efficiency:** M³ appears to be highly token-efficient, achieving over 95% of its peak performance with less than 25% of the maximum displayed token count (150 out of 600).
* **Outliers:** The InstructBLIP-7B point is a notable low-performer relative to its token count (~30 tokens, performance ~36), falling well below the trend lines of both M³ and LLaVA-1.5.
### Interpretation
This chart demonstrates the critical relationship between visual token count and model performance on the MMBench benchmark. The data suggests that:
1. **Diminishing Returns:** There are strong diminishing returns to adding more visual tokens beyond a certain point (around 150-200 for these models). This implies an efficiency frontier in visual token utilization for these architectures.
2. **Architectural Superiority:** The M³ model architecture is fundamentally more effective at translating visual tokens into benchmark performance than LLaVA-1.5, as evidenced by its higher performance curve at all points and its steeper initial ascent.
3. **Performance Gap to Oracle:** The large gap between the best model performance (~66) and the Oracle point (~72) indicates significant room for improvement in multimodal model design, suggesting current models are not fully leveraging the information available in the visual tokens.
4. **Model-Specific Scaling:** The "LLaVA-1.5 Specific Scale" points (green 'X's) closely follow the main LLaVA-1.5 trend line, suggesting consistent scaling behavior for that model family. The scatter of other models (Qwen-VL, InstructBLIP) highlights the variance in performance and token efficiency across different model designs.
In essence, the chart argues that while increasing visual token count improves performance, the choice of model architecture (M³ vs. LLaVA-1.5) is a more significant determinant of both peak performance and token efficiency. The plateau effect also informs practical design choices, suggesting that using a very large number of tokens may not be computationally justified.