# Technical Document Analysis of Chart
## 1. Chart Overview
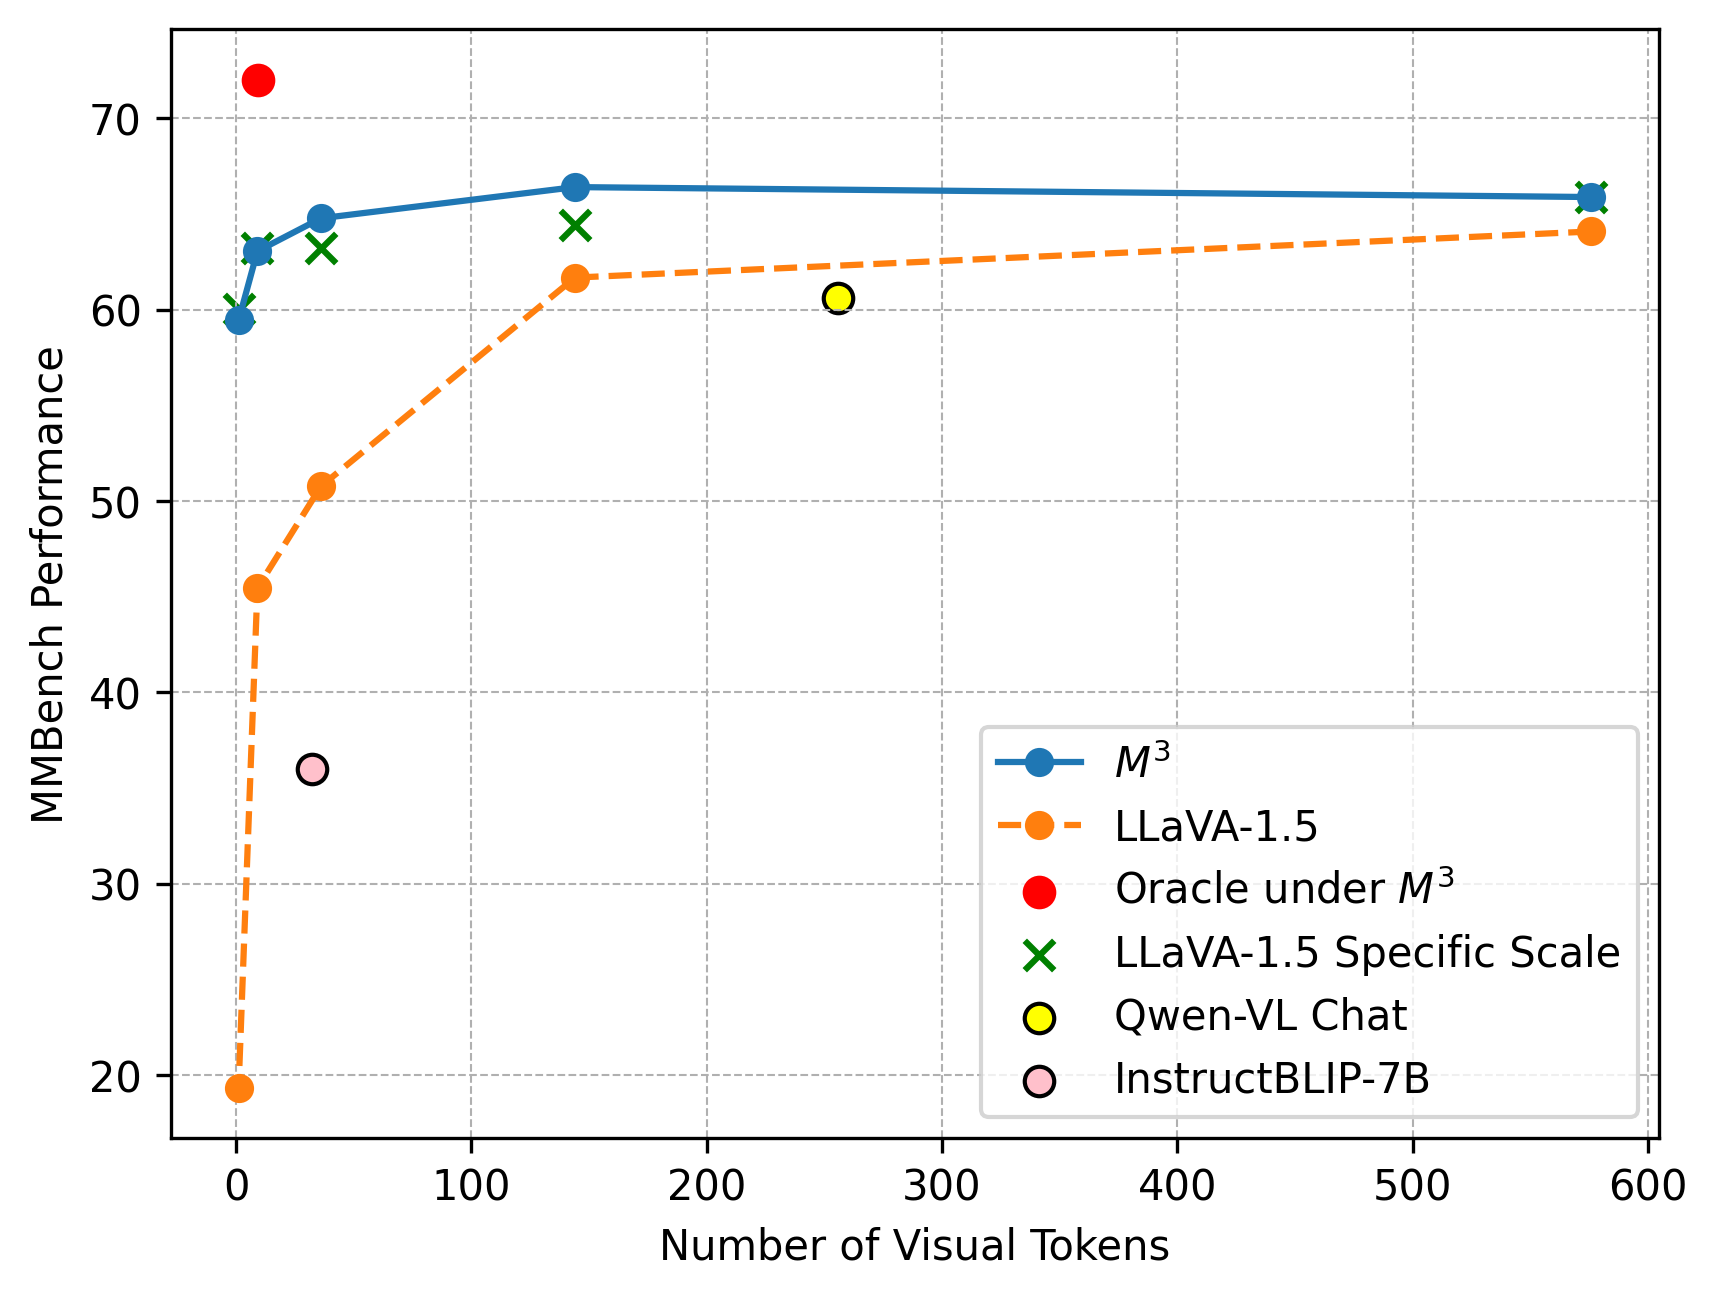
The image is a **line chart** comparing **MMBench Performance** across different AI models as a function of **Number of Visual Tokens**. The chart includes multiple data series with distinct markers and colors, as defined in the legend.
---
## 2. Axis Labels and Scales
- **X-axis**:
- Title: **"Number of Visual Tokens"**
- Range: **0 to 600** (in increments of 100)
- Tick marks: Dashed lines at 0, 100, 200, 300, 400, 500, 600.
- **Y-axis**:
- Title: **"MMBench Performance"**
- Range: **20 to 70** (in increments of 10)
- Tick marks: Dashed lines at 20, 30, 40, 50, 60, 70.
---
## 3. Legend and Data Series
The legend is located in the **bottom-right corner** of the chart. Each data series is represented by a unique color and marker:
| **Legend Label** | **Color** | **Marker** | **Data Series** |
|-------------------------------|-----------|------------|-------------------------------------|
| M³ | Blue | Circle | M³ model performance |
| LLaVA-1.5 | Orange | Dashed line| LLaVA-1.5 model performance |
| Oracle under M³ | Red | Circle | Oracle benchmark under M³ |
| LLaVA-1.5 Specific Scale | Green | Cross | LLaVA-1.5 specific scale performance|
| Qwen-VL Chat | Yellow | Circle | Qwen-VL Chat performance |
| InstructBLIP-7B | Pink | Circle | InstructBLIP-7B performance |
---
## 4. Key Data Points and Trends
### **M³ (Blue Line)**
- **Trend**: Starts at **60** (x=0), rises to **66** (x=150), then slightly declines to **65** (x=550).
- **Key Points**:
- (0, 60)
- (150, 66)
- (550, 65)
### **LLaVA-1.5 (Orange Dashed Line)**
- **Trend**: Sharp increase from **19** (x=0) to **51** (x=50), then stabilizes at **62** (x=150) and **64** (x=550).
- **Key Points**:
- (0, 19)
- (50, 51)
- (150, 62)
- (550, 64)
### **Oracle under M³ (Red Circle)**
- **Trend**: Single data point at **72** (x=0).
- **Key Point**:
- (0, 72)
### **LLaVA-1.5 Specific Scale (Green Cross)**
- **Trend**: Starts at **63** (x=0), drops to **62** (x=150), then rises to **65** (x=550).
- **Key Points**:
- (0, 63)
- (150, 62)
- (550, 65)
### **Qwen-VL Chat (Yellow Circle)**
- **Trend**: Single data point at **61** (x=250).
- **Key Point**:
- (250, 61)
### **InstructBLIP-7B (Pink Circle)**
- **Trend**: Single data point at **36** (x=50).
- **Key Point**:
- (50, 36)
---
## 5. Spatial Grounding and Color Verification
- **Legend Position**: Bottom-right corner.
- **Color Consistency**:
- All data points match their legend labels (e.g., red circle = Oracle under M³, green cross = LLaVA-1.5 Specific Scale).
- No mismatches detected.
---
## 6. Component Isolation
### **Header**:
- No explicit header text.
### **Main Chart**:
- **Lines**:
- M³ (blue) and LLaVA-1.5 (orange) show continuous trends.
- Other series (Oracle, LLaVA-1.5 Specific Scale, Qwen-VL Chat, InstructBLIP-7B) are single points.
- **Markers**:
- Circles (M³, Oracle, Qwen-VL Chat, InstructBLIP-7B).
- Dashed line (LLaVA-1.5).
- Crosses (LLaVA-1.5 Specific Scale).
### **Footer**:
- No explicit footer text.
---
## 7. Summary of Trends
- **M³** maintains the highest performance (60–66) across all token counts.
- **LLaVA-1.5** shows significant improvement from 19 to 64 as token count increases.
- **Oracle under M³** (72) outperforms all models at x=0.
- **LLaVA-1.5 Specific Scale** (63–65) performs consistently above LLaVA-1.5.
- **Qwen-VL Chat** (61) and **InstructBLIP-7B** (36) are single-point comparisons.
---
## 8. Final Notes
- The chart emphasizes **performance scaling** with increasing visual tokens.
- **Oracle under M³** (72) is the highest-performing model at x=0, but its performance is not plotted for higher token counts.
- **LLaVA-1.5** and **M³** are the only models with continuous performance curves.
---
**Note**: The chart does not include a data table or additional textual blocks. All information is derived from axis labels, legend, and plotted data points.