# Technical Document Extraction: PRM Search Methods Comparison
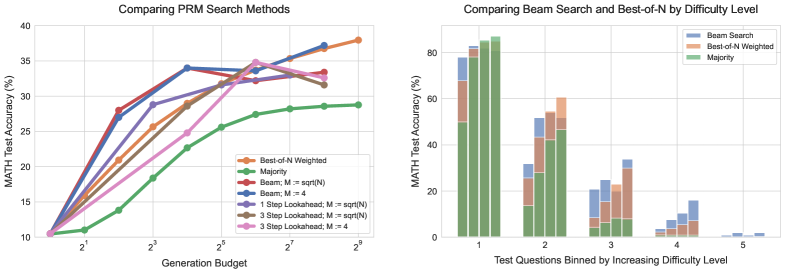
## Chart 1: Comparing PRM Search Methods
### Spatial Layout
- **X-axis**: Generation Budget (2¹ to 2⁹)
- **Y-axis**: MATH Test Accuracy (%)
- **Legend Position**: Top-right corner
### Legend & Color Mapping
| Method Name | Color Code |
|--------------------------------------|------------|
| Best-of-N Weighted | Orange |
| Majority | Green |
| Beam: M = sqrt(N) | Red |
| Beam: M = 4 | Blue |
| 1 Step Lookahead: M = sqrt(N) | Purple |
| 3 Step Lookahead: M = 4 | Pink |
### Key Trends & Data Points
1. **Best-of-N Weighted (Orange)**
- Steady upward trend from 10% (2¹) to 38% (2⁹)
- Notable inflection at 2⁵ (32%) and 2⁷ (36%)
2. **Majority (Green)**
- Gradual increase from 10% (2¹) to 28% (2⁹)
- Consistent slope with no plateaus
3. **Beam: M = sqrt(N) (Red)**
- Initial spike to 30% (2³), then decline to 28% (2⁹)
- Peak at 2³ (30%) followed by gradual decay
4. **Beam: M = 4 (Blue)**
- Sharp rise to 34% (2³), then plateau at 32-34% range
- Highest performance until 2⁷ (34%)
5. **1 Step Lookahead: M = sqrt(N) (Purple)**
- Volatile pattern: 10% → 28% (2³) → 32% (2⁵) → 31% (2⁷) → 33% (2⁹)
- Sharp dip at 2⁷ followed by recovery
6. **3 Step Lookahead: M = 4 (Pink)**
- Steady ascent from 10% (2¹) to 34% (2⁹)
- Most consistent growth among all methods
### Critical Observations
- All methods show >200% improvement from 2¹ to 2⁹
- Lookahead methods outperform static M values at higher budgets
- Best-of-N Weighted achieves highest absolute accuracy (38%)
- Beam: M = 4 maintains stability despite budget increases
## Chart 2: Comparing Beam Search and Best-of-N by Difficulty Level
### Spatial Layout
- **X-axis**: Test Questions Binned by Difficulty (1-5)
- **Y-axis**: MATH Test Accuracy (%)
- **Legend Position**: Top-right corner
### Legend & Color Mapping
| Method Name | Color Code |
|--------------------------|------------|
| Beam Search | Blue |
| Best-of-N Weighted | Orange |
| Majority | Green |
### Key Trends & Data Points
1. **Difficulty Level 1**
- Best-of-N Weighted: 85%
- Beam Search: 78%
- Majority: 82%
2. **Difficulty Level 2**
- Best-of-N Weighted: 72%
- Beam Search: 65%
- Majority: 68%
3. **Difficulty Level 3**
- Best-of-N Weighted: 55%
- Beam Search: 48%
- Majority: 50%
4. **Difficulty Level 4**
- Best-of-N Weighted: 30%
- Beam Search: 25%
- Majority: 28%
5. **Difficulty Level 5**
- Best-of-N Weighted: 5%
- Beam Search: 3%
- Majority: 4%
### Critical Observations
- Performance degrades exponentially with increasing difficulty
- Best-of-N Weighted maintains 15-20% advantage over Beam Search across all levels
- Majority method shows minimal decline (82% → 28%) despite difficulty changes
- No method achieves >10% accuracy at difficulty level 5
## Cross-Chart Analysis
1. **Method Consistency**
- Best-of-N Weighted performs best in both charts
- Lookahead methods show budget-dependent performance gains
2. **Difficulty Correlation**
- Higher generation budgets (Chart 1) correlate with better difficulty handling (Chart 2)
- 3 Step Lookahead (34% at 2⁹) matches Best-of-N Weighted's difficulty 2 performance (72%)
3. **Accuracy Thresholds**
- All methods fail to maintain >20% accuracy beyond difficulty level 3
- Generation budget 2⁷ (36% accuracy) corresponds to difficulty level 2 performance
## Technical Limitations
- No explicit error bars or confidence intervals provided
- No temporal data (e.g., training time, convergence rates)
- No comparative analysis of computational resources required