## Heatmap: Dataset Performance Comparison
### Overview
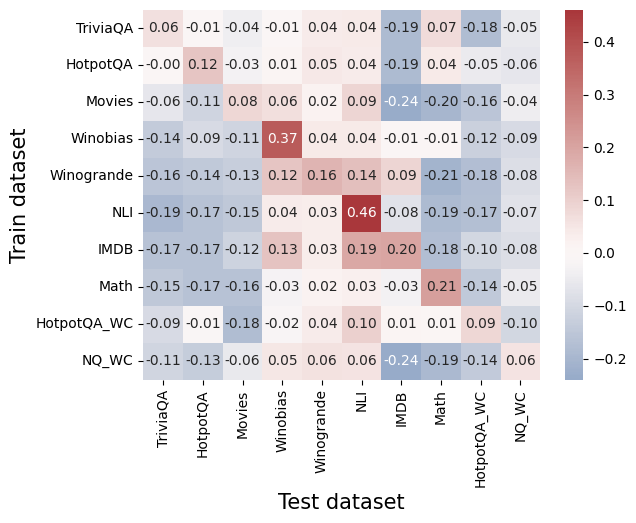
The image is a heatmap visualizing the performance of different datasets when used for training and testing. The rows represent the training datasets, the columns represent the testing datasets, and the color of each cell indicates the performance score (correlation), with red indicating positive correlation and blue indicating negative correlation. A color bar on the right provides the scale for the correlation values.
### Components/Axes
* **X-axis (Test dataset):** TriviaQA, HotpotQA, Movies, Winobias, Winogrande, NLI, IMDB, Math, HotpotQA\_WC, NQ\_WC
* **Y-axis (Train dataset):** TriviaQA, HotpotQA, Movies, Winobias, Winogrande, NLI, IMDB, Math, HotpotQA\_WC, NQ\_WC
* **Color Scale:** Ranges from -0.2 (dark blue) to 0.4 (dark red). The scale includes markers at -0.2, -0.1, 0.0, 0.1, 0.2, 0.3, and 0.4.
### Detailed Analysis
Here's a breakdown of the values in the heatmap, row by row:
* **TriviaQA:**
* TriviaQA: -0.06
* HotpotQA: -0.01
* Movies: -0.04
* Winobias: -0.01
* Winogrande: 0.04
* NLI: 0.04
* IMDB: -0.19
* Math: 0.07
* HotpotQA\_WC: -0.18
* NQ\_WC: -0.05
* **HotpotQA:**
* TriviaQA: -0.00
* HotpotQA: 0.12
* Movies: -0.03
* Winobias: 0.01
* Winogrande: 0.05
* NLI: 0.04
* IMDB: -0.19
* Math: 0.04
* HotpotQA\_WC: -0.05
* NQ\_WC: -0.06
* **Movies:**
* TriviaQA: -0.06
* HotpotQA: -0.11
* Movies: 0.08
* Winobias: 0.06
* Winogrande: 0.02
* NLI: 0.09
* IMDB: -0.24
* Math: -0.20
* HotpotQA\_WC: -0.16
* NQ\_WC: -0.04
* **Winobias:**
* TriviaQA: -0.14
* HotpotQA: -0.09
* Movies: -0.11
* Winobias: 0.37
* Winogrande: 0.04
* NLI: 0.04
* IMDB: -0.01
* Math: -0.01
* HotpotQA\_WC: -0.12
* NQ\_WC: -0.09
* **Winogrande:**
* TriviaQA: -0.16
* HotpotQA: -0.14
* Movies: -0.13
* Winobias: 0.12
* Winogrande: 0.16
* NLI: 0.14
* IMDB: 0.09
* Math: -0.21
* HotpotQA\_WC: -0.18
* NQ\_WC: -0.08
* **NLI:**
* TriviaQA: -0.19
* HotpotQA: -0.17
* Movies: -0.15
* Winobias: 0.04
* Winogrande: 0.03
* NLI: 0.46
* IMDB: -0.08
* Math: -0.19
* HotpotQA\_WC: -0.17
* NQ\_WC: -0.07
* **IMDB:**
* TriviaQA: -0.17
* HotpotQA: -0.17
* Movies: -0.12
* Winobias: 0.13
* Winogrande: 0.03
* NLI: 0.19
* IMDB: 0.20
* Math: -0.18
* HotpotQA\_WC: -0.10
* NQ\_WC: -0.08
* **Math:**
* TriviaQA: -0.15
* HotpotQA: -0.17
* Movies: -0.16
* Winobias: -0.03
* Winogrande: 0.02
* NLI: 0.03
* IMDB: -0.03
* Math: 0.21
* HotpotQA\_WC: -0.14
* NQ\_WC: -0.05
* **HotpotQA\_WC:**
* TriviaQA: -0.09
* HotpotQA: -0.01
* Movies: -0.18
* Winobias: -0.02
* Winogrande: 0.04
* NLI: 0.10
* IMDB: 0.01
* Math: 0.01
* HotpotQA\_WC: 0.09
* NQ\_WC: -0.10
* **NQ\_WC:**
* TriviaQA: -0.11
* HotpotQA: -0.13
* Movies: -0.06
* Winobias: 0.05
* Winogrande: 0.06
* NLI: 0.06
* IMDB: -0.24
* Math: -0.19
* HotpotQA\_WC: -0.14
* NQ\_WC: 0.06
### Key Observations
* The diagonal elements (where the training and testing datasets are the same) generally show positive correlation, indicating that models perform best when tested on data similar to what they were trained on.
* NLI trained and tested on itself has the highest correlation (0.46).
* Winobias trained and tested on itself has a high correlation (0.37).
* Movies trained on itself has a low correlation (0.08).
* IMDB trained on itself has a correlation of 0.20.
* Math trained on itself has a correlation of 0.21.
* Using Movies as the test dataset often results in negative correlations, especially when trained on IMDB (-0.24) and Math (-0.20).
* Using IMDB as the test dataset often results in negative correlations, especially when trained on TriviaQA (-0.19), HotpotQA (-0.19), and Movies (-0.24).
### Interpretation
The heatmap reveals how well different datasets generalize to each other. High positive correlations along the diagonal suggest that models trained and tested on the same dataset perform well. Off-diagonal elements indicate how well a model trained on one dataset can generalize to another. Negative correlations suggest that the datasets are dissimilar, and models trained on one perform poorly on the other. The NLI dataset appears to be the most robust, showing the highest positive correlation when trained and tested on itself. The Movies dataset, when used as a test set, often leads to negative correlations, suggesting it may have different characteristics compared to the other datasets. The Winobias dataset also shows a strong positive correlation when trained and tested on itself, indicating its unique characteristics.