## Heatmap: Correlation Between Train and Test Datasets
### Overview
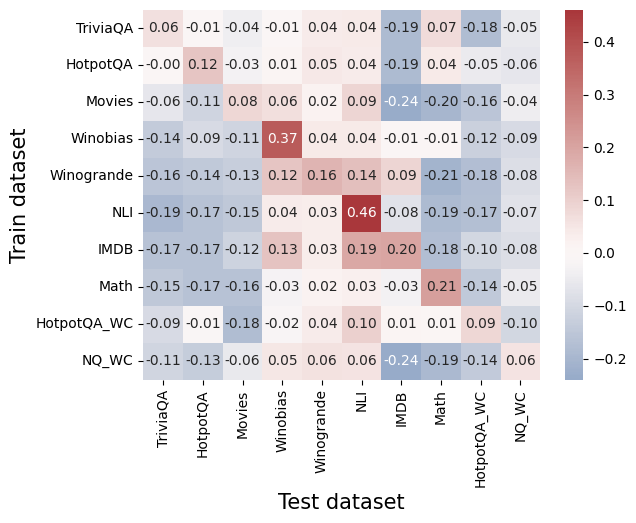
The image is a heatmap visualizing the correlation between different train and test datasets. Each cell represents the correlation coefficient between a specific train dataset (y-axis) and test dataset (x-axis). The color scale ranges from -0.2 (blue) to 0.4 (red), with darker shades indicating stronger correlations.
### Components/Axes
- **X-axis (Test dataset)**: TriviaQA, HotpotQA, Movies, Winobias, Winogrande, NLI, IMDB, Math, HotpotQA_WC, NQ_WC
- **Y-axis (Train dataset)**: Same categories as X-axis
- **Color legend**: Vertical bar on the right, ranging from -0.2 (blue) to 0.4 (red), with intermediate values at -0.1, 0.0, 0.1, 0.2, 0.3, 0.4
### Detailed Analysis
- **Diagonal values** (train = test):
- Highest positive correlation: **NLI (0.46)**
- Other notable values:
- TriviaQA (0.06), HotpotQA (0.12), Movies (0.06), Winobias (0.37), Winogrande (0.16), IMDB (0.13), Math (0.21), HotpotQA_WC (0.09), NQ_WC (0.06)
- **Off-diagonal values**:
- Strongest negative correlation: **IMDB vs IMDB (-0.24)**
- Other notable values:
- IMDb vs Math (-0.18), IMDb vs NLI (-0.08), IMDb vs HotpotQA_WC (-0.10)
- Math vs IMDb (0.21), Math vs NLI (-0.14)
- Winobias vs Winobias (0.37), Winobias vs Winogrande (0.12)
### Key Observations
1. **Diagonal dominance**: Models trained and tested on the same dataset show the strongest correlations (e.g., NLI at 0.46).
2. **Negative correlations**: Some datasets exhibit negative self-correlations (e.g., IMDb at -0.24), suggesting potential overfitting or dataset-specific anomalies.
3. **Cross-dataset performance**:
- Math-trained models perform well on IMDb (0.21).
- IMDb-trained models perform poorly on IMDb (-0.24) but moderately on Math (0.21).
4. **Winobias and Winogrande**: Show moderate positive correlations with themselves (0.37 and 0.16, respectively).
### Interpretation
The heatmap reveals that **dataset-specific training yields the highest performance**, as evidenced by the diagonal values. However, **IMDb’s negative self-correlation (-0.24)** is an outlier, indicating potential issues with dataset consistency or model generalization. Cross-dataset performance varies, with Math-trained models showing strong transfer to IMDb (0.21), suggesting shared features between these datasets. The negative correlation between IMDb and itself may reflect dataset-specific noise or biases that degrade model reliability when tested on the same data.
**Notable trends**:
- Red cells (positive) dominate the diagonal, emphasizing dataset-specific efficacy.
- Blue cells (negative) are sparse but significant, particularly for IMDb.
- Math and IMDb exhibit a bidirectional positive correlation (0.21), suggesting overlapping linguistic or structural patterns.