## Line Chart: 1-NN Accuracy vs. Representation Size
### Overview
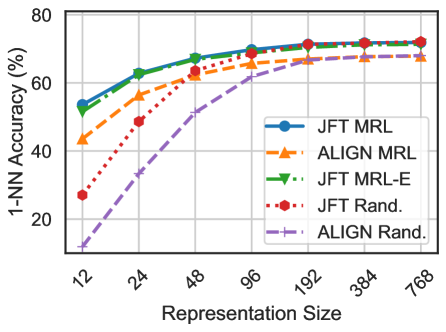
The image is a line chart comparing the 1-Nearest Neighbor (1-NN) accuracy of different models (JFT and ALIGN) using various representation learning techniques (MRL, MRL-E, and Rand.) across different representation sizes. The x-axis represents the representation size, and the y-axis represents the 1-NN accuracy in percentage.
### Components/Axes
* **X-axis:** Representation Size, with values 12, 24, 48, 96, 192, 384, and 768.
* **Y-axis:** 1-NN Accuracy (%), with a scale from 20 to 80 in increments of 20.
* **Legend (Top-right):**
* Blue line with circles: JFT MRL
* Orange dashed line with triangles: ALIGN MRL
* Green dashed line with inverted triangles: JFT MRL-E
* Red dotted line with circles: JFT Rand.
* Purple dashed-dotted line with plus signs: ALIGN Rand.
### Detailed Analysis
* **JFT MRL (Blue):** Starts at approximately 53% accuracy at representation size 12, increases to around 63% at 24, 68% at 48, 70% at 96, and plateaus around 72-73% for representation sizes 192, 384, and 768.
* **ALIGN MRL (Orange):** Starts at approximately 43% accuracy at representation size 12, increases to around 58% at 24, 65% at 48, 67% at 96, and plateaus around 68-70% for representation sizes 192, 384, and 768.
* **JFT MRL-E (Green):** Starts at approximately 53% accuracy at representation size 12, increases to around 63% at 24, 68% at 48, 70% at 96, and plateaus around 72-73% for representation sizes 192, 384, and 768.
* **JFT Rand. (Red):** Starts at approximately 28% accuracy at representation size 12, increases to around 47% at 24, 61% at 48, 67% at 96, and plateaus around 70-71% for representation sizes 192, 384, and 768.
* **ALIGN Rand. (Purple):** Starts at approximately 12% accuracy at representation size 12, increases to around 35% at 24, 50% at 48, 60% at 96, and plateaus around 65-67% for representation sizes 192, 384, and 768.
### Key Observations
* JFT MRL and JFT MRL-E perform similarly and consistently achieve the highest 1-NN accuracy across all representation sizes.
* ALIGN MRL performs slightly worse than JFT MRL and JFT MRL-E.
* JFT Rand. performs better than ALIGN Rand.
* All models show a significant increase in accuracy as the representation size increases from 12 to 96, after which the accuracy plateaus.
* The "Rand." methods (JFT Rand. and ALIGN Rand.) start with the lowest accuracy but eventually converge towards the performance of the MRL methods as the representation size increases.
### Interpretation
The chart demonstrates the impact of representation size on the 1-NN accuracy of different models and representation learning techniques. The MRL and MRL-E techniques consistently outperform the random initialization ("Rand.") methods, especially at smaller representation sizes. As the representation size increases, the performance gap between the MRL and Rand. methods narrows, suggesting that larger representation sizes can compensate for less effective initialization strategies. The plateauing of accuracy beyond a representation size of 96 indicates diminishing returns, suggesting that further increases in representation size may not significantly improve performance. The similarity in performance between JFT MRL and JFT MRL-E suggests that the "E" variant does not offer a substantial advantage in terms of 1-NN accuracy.