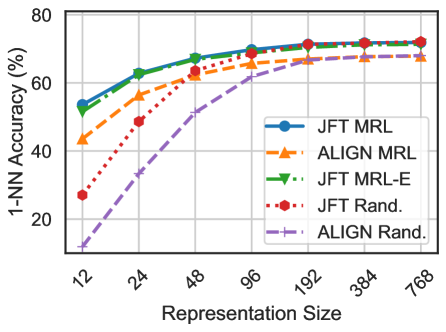
## Line Graph: 1-NN Accuracy vs. Representation Size
### Overview
The image is a line graph comparing the 1-NN (1-Nearest Neighbor) classification accuracy of five different methods across varying representation sizes. The x-axis represents representation size (logarithmically scaled), and the y-axis shows accuracy percentage. Five data series are plotted with distinct line styles and markers, each corresponding to a method in the legend.
### Components/Axes
- **X-axis (Representation Size)**: Logarithmic scale with markers at 12, 24, 48, 96, 192, 384, and 768.
- **Y-axis (1-NN Accuracy %)**: Linear scale from 0% to 80% in 20% increments.
- **Legend**: Located in the top-right corner, with five entries:
- **JFT MRL**: Solid blue line with circle markers.
- **ALIGN MRL**: Dashed orange line with triangle markers.
- **JFT MRL-E**: Dotted green line with arrow markers.
- **JFT Rand.**: Dotted red line with hexagon markers.
- **ALIGN Rand.**: Dashed purple line with plus markers.
### Detailed Analysis
1. **JFT MRL (Blue)**:
- Starts at ~50% accuracy at 12 representation size.
- Increases steadily to ~70% at 768.
- Slope is consistent, with minimal fluctuation.
2. **ALIGN MRL (Orange)**:
- Begins at ~40% at 12, rising to ~65% at 768.
- Slope is slightly steeper than JFT MRL but plateaus near 65% after 192.
3. **JFT MRL-E (Green)**:
- Similar trend to JFT MRL but consistently ~5% lower.
- Starts at ~45% at 12, reaching ~65% at 768.
4. **JFT Rand. (Red)**:
- Starts at ~25% at 12, rising sharply to ~60% at 768.
- Slope is steeper than JFT MRL-E but less consistent.
5. **ALIGN Rand. (Purple)**:
- Begins at ~10% at 12, increasing to ~60% at 768.
- Slope is the steepest among all series but shows variability.
### Key Observations
- **Performance Trends**: All methods improve with larger representation sizes, but the rate of improvement diminishes as size increases.
- **JFT MRL vs. ALIGN MRL**: JFT MRL consistently outperforms ALIGN MRL across all sizes, though the gap narrows at larger sizes.
- **Random Baselines**: Both JFT Rand. and ALIGN Rand. start significantly lower but converge with non-random methods at larger sizes (~60% at 768).
- **JFT MRL-E**: Underperforms JFT MRL but outperforms all random methods.
### Interpretation
The data suggests that **JFT MRL** is the most robust method, maintaining high accuracy across representation sizes. **ALIGN MRL** and **JFT MRL-E** show comparable performance to JFT MRL but with slight trade-offs in consistency or magnitude. The random methods (JFT Rand. and ALIGN Rand.) demonstrate that structured approaches (MRL) significantly outperform random baselines, especially at smaller representation sizes. The convergence of random methods at larger sizes implies diminishing returns for structured methods as representation complexity increases. This could indicate that larger representations inherently capture more discriminative features, reducing the need for sophisticated alignment or error-correction mechanisms.