\n
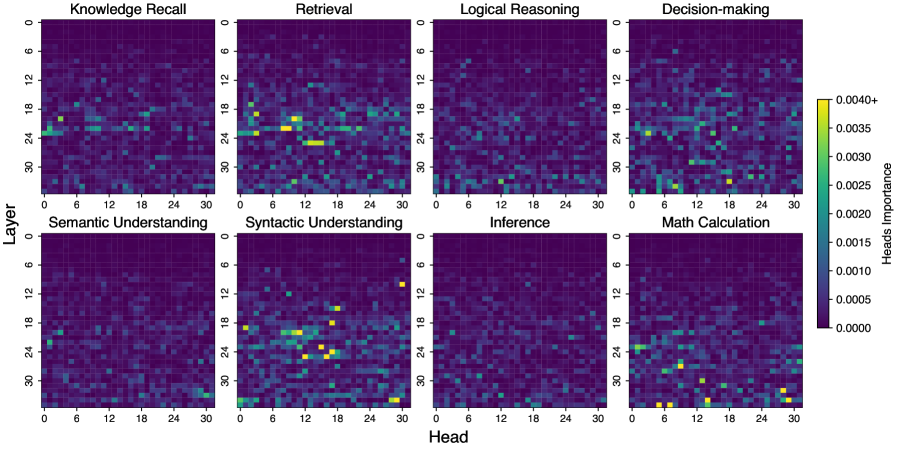
## Heatmaps: Layer-wise Attention Analysis
### Overview
The image presents a 2x4 grid of heatmaps, each representing the attention weights of a neural network model across different layers and heads for various tasks. Each heatmap visualizes the attention distribution, with color intensity indicating the strength of attention. The x-axis represents the "Head" (ranging from 0 to 30), and the y-axis represents the "Layer" (ranging from 0 to 30). A colorbar on the right indicates the attention weight scale, ranging from approximately 0.0000 to 0.0040+.
### Components/Axes
* **X-axis:** "Head" - Ranges from 0 to 30, with approximately 31 markers.
* **Y-axis:** "Layer" - Ranges from 0 to 30, with approximately 31 markers.
* **Colorbar:** Represents attention weight, ranging from 0.0000 (dark purple) to 0.0040+ (yellow).
* **Heatmap Titles (Top Row):**
* Knowledge Recall
* Retrieval
* Logical Reasoning
* Decision-making
* **Heatmap Titles (Bottom Row):**
* Semantic Understanding
* Syntactic Understanding
* Inference
* Math Calculation
### Detailed Analysis or Content Details
Each heatmap shows a distinct pattern of attention weights. I will describe each heatmap individually, noting trends and approximate values.
**1. Knowledge Recall:**
* Trend: Attention is concentrated in a diagonal band, starting around Head 10 and Layer 10, extending to Head 25 and Layer 25. There's also some scattered attention in the lower-left corner (low Head, low Layer).
* Approximate Values: The highest attention weights (yellow) are around 0.0035, concentrated in the diagonal band. Most other areas are in the 0.0005 - 0.0015 range (various shades of purple).
**2. Retrieval:**
* Trend: Similar to Knowledge Recall, a diagonal band of attention is present, but it's more diffuse and extends further towards the upper-right corner. There's also a noticeable concentration of attention around Head 0-10 and Layer 0-6.
* Approximate Values: Maximum attention weights (yellow) reach approximately 0.0038. The majority of the heatmap is in the 0.0005 - 0.0020 range.
**3. Logical Reasoning:**
* Trend: A very strong diagonal band of attention dominates this heatmap, starting around Head 6 and Layer 6 and extending to Head 28 and Layer 28. Attention is highly localized along this diagonal.
* Approximate Values: The highest attention weights (yellow) are around 0.0040+. The band is very clearly defined, with sharp transitions to lower attention weights (0.0005 - 0.0015) outside the band.
**4. Decision-making:**
* Trend: A broad diagonal band of attention, similar to Retrieval, but with a more gradual transition to lower attention weights. There's also some attention scattered throughout the heatmap.
* Approximate Values: Maximum attention weights (yellow) are around 0.0035. The heatmap is generally brighter than Knowledge Recall, with more areas in the 0.0015 - 0.0025 range.
**5. Semantic Understanding:**
* Trend: A strong diagonal band of attention, similar to Logical Reasoning, but slightly less defined. There's also some attention in the lower-left corner.
* Approximate Values: Maximum attention weights (yellow) are around 0.0038. The band is well-defined, with attention dropping to 0.0005 - 0.0015 outside the band.
**6. Syntactic Understanding:**
* Trend: A very strong diagonal band of attention, similar to Logical Reasoning, but even more localized.
* Approximate Values: The highest attention weights (yellow) are around 0.0040+. The band is extremely sharp, with very little attention outside of it.
**7. Inference:**
* Trend: A diagonal band of attention, similar to Retrieval and Decision-making, but with a more pronounced concentration of attention in the upper-right corner.
* Approximate Values: Maximum attention weights (yellow) are around 0.0035. The heatmap is generally brighter than Knowledge Recall, with more areas in the 0.0015 - 0.0025 range.
**8. Math Calculation:**
* Trend: A strong diagonal band of attention, similar to Logical Reasoning and Semantic Understanding, but with a slightly different slope.
* Approximate Values: Maximum attention weights (yellow) are around 0.0038. The band is well-defined, with attention dropping to 0.0005 - 0.0015 outside the band.
### Key Observations
* **Diagonal Attention:** A consistent trend across all tasks is the presence of a diagonal band of attention, suggesting that attention tends to focus on relationships between layers and heads that are relatively close to each other.
* **Task-Specific Patterns:** The strength and localization of the diagonal band vary across tasks. Logical Reasoning and Syntactic Understanding exhibit the most focused attention, while Retrieval and Decision-making have more diffuse attention patterns.
* **Lower-Left Corner Attention:** Some tasks (Knowledge Recall, Semantic Understanding) show attention in the lower-left corner, potentially indicating early-layer, early-head interactions.
### Interpretation
The heatmaps reveal how the model allocates its attention resources across different layers and heads for various cognitive tasks. The diagonal attention patterns suggest that the model learns to process information in a hierarchical manner, with attention flowing from lower layers to higher layers and between nearby heads. The task-specific variations in attention patterns indicate that the model adapts its attention strategy depending on the complexity and nature of the task. The strong attention in Logical Reasoning and Syntactic Understanding suggests that these tasks require more precise and focused attention mechanisms. The presence of attention in the lower-left corner for certain tasks may indicate that the model relies on early-layer interactions for specific types of knowledge or processing. The colorbar provides a quantitative measure of attention strength, allowing for comparison of attention levels across tasks and layers. This visualization is valuable for understanding the internal workings of the model and identifying potential areas for improvement.