## Block Diagram: Data Processing and Routing Architecture
### Overview
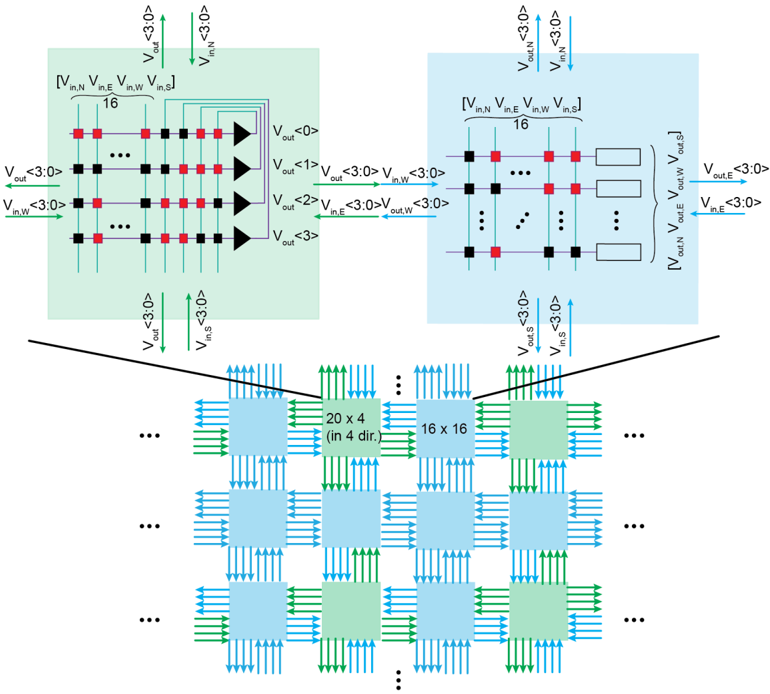
The image depicts a hierarchical block diagram of a data processing and routing system. It consists of three primary regions:
1. **Top-left (Green Box)**: A processing unit with labeled inputs (V_in_N, V_in_E, V_in_W, V_in_S) and outputs (V_out_0 to V_out_3).
2. **Top-right (Blue Box)**: A secondary processing unit with similar inputs but outputs labeled V_out_N, V_out_E, V_out_W, V_out_S.
3. **Bottom Grid**: A modular network of interconnected blocks labeled "20 x 4 (in 4 dir.)" and "16 x 16," with directional arrows indicating data flow.
### Components/Axes
- **Inputs/Outputs**:
- **Green Box**:
- Inputs: `V_in_N`, `V_in_E`, `V_in_W`, `V_in_S` (labeled with arrows pointing into the box).
- Outputs: `V_out_0`, `V_out_1`, `V_out_2`, `V_out_3` (labeled with arrows pointing out of the box).
- **Blue Box**:
- Inputs: `V_in_N`, `V_in_E`, `V_in_W`, `V_in_S` (same as green box).
- Outputs: `V_out_N`, `V_out_E`, `V_out_W`, `V_out_S` (labeled with arrows pointing out of the box).
- **Grid Labels**:
- "20 x 4 (in 4 dir.)": Indicates a block configuration with 20 rows and 4 columns, operating in 4 directions.
- "16 x 16": Indicates a square block configuration with 16 rows and 16 columns.
- **Arrows**:
- Green arrows (→) represent data flow from inputs to outputs.
- Blue arrows (↑/↓) indicate vertical data routing.
- Red squares (■) and black squares (■) in the green box may represent processing units or control logic.
### Detailed Analysis
- **Green Box**:
- Contains 16 red squares (■) and 16 black squares (■) arranged in a grid.
- Arrows connect inputs to outputs via these squares, suggesting conditional or parallel processing.
- Outputs `V_out_0` to `V_out_3` are labeled with directional arrows, implying discrete data streams.
- **Blue Box**:
- Contains 16 red squares (■) and 16 black squares (■) in a similar grid.
- Outputs `V_out_N`, `V_out_E`, `V_out_W`, `V_out_S` suggest directional routing (North, East, West, South).
- **Grid Network**:
- Composed of alternating blue and green blocks.
- Labels "20 x 4" and "16 x 16" indicate varying block sizes, possibly representing different processing capacities or data throughput rates.
- Arrows connect blocks in a grid pattern, suggesting a scalable or modular architecture.
### Key Observations
1. **Modular Design**: The system uses repeatable blocks (e.g., 16x16, 20x4) for scalability.
2. **Directional Routing**: Outputs in the blue box are labeled with cardinal directions, implying spatial or directional data handling.
3. **Conditional Processing**: Red and black squares in the green box may represent logic gates or decision points.
4. **Data Flow**: Arrows indicate a hierarchical flow from inputs to outputs, with potential feedback loops (e.g., `V_out_3` feeding back into the grid).
### Interpretation
This diagram likely represents a **parallel data processing system** with modular components. The green and blue boxes act as processing stages, while the grid below represents a network for routing or distributing processed data. The use of directional labels (N, E, W, S) suggests applications in spatial data handling, such as sensor networks or communication systems. The varying block sizes (16x16 vs. 20x4) may indicate optimization for different data types or computational loads.
**Notable Patterns**:
- The green box processes inputs into four discrete outputs, while the blue box routes outputs directionally.
- The grid’s "20 x 4" and "16 x 16" blocks suggest a balance between granularity and scalability.
**Underlying Functionality**:
The system could be part of a **distributed computing framework**, where inputs are processed in parallel (green/blue boxes) and then aggregated or routed through a network (grid). The directional outputs imply applications in robotics, IoT, or real-time data analytics.