TECHNICAL ASSET FINGERPRINT
e6134c021e123770bb1b78de
Click to view fullscreen
Press ESC or click to close
FOUND IN PAPERS
EXPERT: gemini-2.5-flash-free VERSION 1
RUNTIME: google-free/gemini-2.5-flash
INTEL_VERIFIED
## Diagram: GenPRM System for Solution Generation, Rationale Synthesis, and Reward Estimation
### Overview
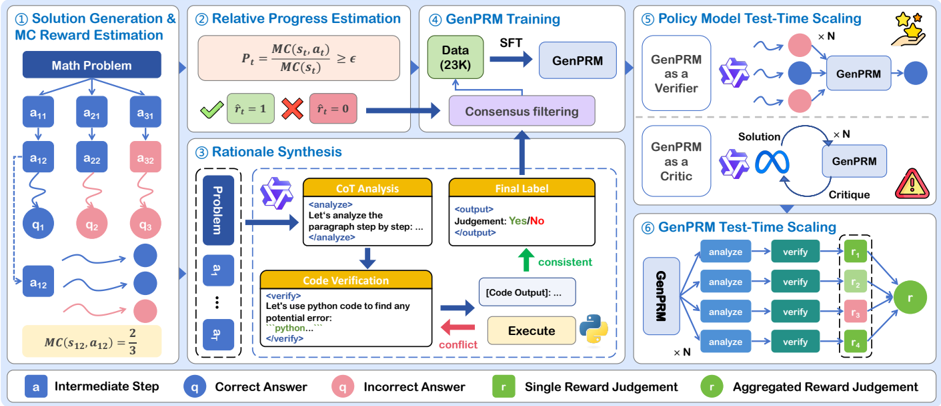
This image presents a complex system diagram illustrating the architecture and workflow of a "GenPRM" (Generative Process Reward Model) system. It details six interconnected stages: Solution Generation & Monte Carlo (MC) Reward Estimation, Relative Progress Estimation, Rationale Synthesis, GenPRM Training, Policy Model Test-Time Scaling, and GenPRM Test-Time Scaling. The diagram uses various shapes and colors to represent different steps, components, and outcomes, with a legend provided at the bottom for clarity.
### Components/Axes
The diagram is structured into six distinct, numbered sections, each representing a phase in the GenPRM system. A legend at the bottom defines the meaning of specific visual elements:
* **Blue square 'a'**: Intermediate Step
* **Blue circle 'q'**: Correct Answer
* **Red circle 'q'**: Incorrect Answer
* **Green square 'r'**: Single Reward Judgement
* **Dark green circle 'r'**: Aggregated Reward Judgement
Other recurring symbols and labels include:
* **Dark blue rectangles**: Initial problem or major process steps.
* **Light blue rectangles**: "GenPRM" model instances.
* **Yellow boxes**: Specific analysis or verification steps with embedded text.
* **Purple boxes**: Filtering or consensus mechanisms.
* **Pink boxes**: Formulas or specific outcomes.
* **GenPRM logo (purple, stylized 'G')**: Represents the GenPRM agent or model.
* **Python logo (yellow/blue snake)**: Indicates code execution.
* **Stars icon**: Represents reward or success.
* **Warning triangle icon**: Represents a potential issue or failure.
* **Infinity symbol**: Represents an iterative or continuous process.
### Detailed Analysis
The diagram is segmented into six main processes:
**1. Solution Generation & MC Reward Estimation (Top-Left)**
* **Input**: A dark blue rectangle labeled "Math Problem".
* **Process**: The "Math Problem" branches into three initial "Intermediate Step" (blue square 'a') paths: `a11`, `a21`, `a31`.
* These steps further lead to `a12`, `a22`, `a32` (blue/red squares).
* **Outcomes**:
* `a12` leads to `q1` (blue circle, Correct Answer).
* `a22` leads to `q2` (red circle, Incorrect Answer).
* `a32` leads to `q3` (red circle, Incorrect Answer).
* **Feedback/Refinement**: A wavy line from `a12` indicates further processing leading to multiple blue circles (Correct Answers). Similarly, wavy lines from other paths lead to red circles (Incorrect Answers).
* **Calculation**: A yellow box at the bottom states `MC(s12, a12) = 2/3`, indicating a Monte Carlo reward estimation for a specific state `s12` and action `a12`.
**2. Relative Progress Estimation (Top-Center)**
* **Formula**: A pink box displays the formula `Pt = MC(st, at) / MC(st) >= ε`, where `Pt` is likely progress, `MC` is Monte Carlo, `st` is state, `at` is action, and `ε` is a threshold.
* **Outcomes**:
* A green box with a checkmark indicates `r̂t = 1` (estimated reward is 1, likely success).
* A pink box with a red 'X' indicates `r̂t = 0` (estimated reward is 0, likely failure).
* **Flow**: Both outcomes lead to a purple box labeled "Consensus filtering".
**3. Rationale Synthesis (Mid-Left/Center)**
* **Input**: A dashed box on the left contains a vertical dark blue rectangle labeled "Problem", followed by `a1`, an ellipsis `...`, and `aT` (representing a sequence of intermediate steps).
* **Process 1 (CoT Analysis)**:
* The GenPRM logo feeds into a yellow box labeled "CoT Analysis" (Chain-of-Thought Analysis).
* **Text**: `<analyze> Let's analyze the paragraph step by step: ... </analyze>`
* This leads to a yellow box labeled "Final Label".
* **Text**: `<output> Judgement: Yes/No </output>`
* **Process 2 (Code Verification)**:
* The GenPRM logo also feeds into a yellow box labeled "Code Verification".
* **Text**: `<verify> Let's use python code to find any potential error: ```python...``` </verify>`
* This leads to an "Execute" step (yellow box with Python logo).
* The "Execute" step produces "[Code Output]: ..." (white box).
* **Consistency/Conflict**:
* A green upward arrow labeled "consistent" connects "[Code Output]: ..." to "Final Label".
* A red leftward arrow labeled "conflict" connects "Execute" back to "Code Verification".
* **Output**: The "Final Label" box feeds into the "Consensus filtering" purple box.
**4. GenPRM Training (Top-Right)**
* **Input**: A green box labeled "Data (23K)", indicating 23,000 data points.
* **Process**: An arrow labeled "SFT" (Supervised Fine-Tuning) leads from "Data (23K)" to a light blue box labeled "GenPRM".
* **Feedback**: The "Consensus filtering" purple box (from sections 2 and 3) feeds back into "Data (23K)", suggesting a mechanism for data refinement or augmentation based on consensus.
**5. Policy Model Test-Time Scaling (Mid-Right)**
This section is divided into two sub-sections:
* **GenPRM as a Verifier**:
* Input: GenPRM logo.
* Process: Wavy lines lead to multiple instances (indicated by `x N`) of blue and red circles (Correct/Incorrect Answers). These are then processed by another "GenPRM" (light blue box).
* Output: A single blue circle (Correct Answer) and a "stars" icon, implying successful verification and reward.
* **GenPRM as a Critic**:
* Input: GenPRM logo and an "infinity" symbol providing "Solution" (labeled on the arrow).
* Process: The "Solution" feeds into a "GenPRM" (light blue box) with a circular arrow labeled "Critique" feeding back to itself, indicating an iterative critique process. The "x N" label suggests multiple critiques.
* Output: A red warning triangle icon, implying that the critique process identifies issues or failures.
**6. GenPRM Test-Time Scaling (Bottom-Right)**
* **Input**: A light blue box labeled "GenPRM", with an "x N" label below it, indicating N parallel instances.
* **Process**: The GenPRM branches into N parallel paths, each consisting of:
* "analyze" (blue box) -> "verify" (green box).
* These lead to individual "Single Reward Judgement" (green/red squares 'r'): `r1`, `r2`, `r3`, `r4` are explicitly shown within a dashed box, implying multiple such judgments.
* **Output**: All individual reward judgments (`r1` through `rN`) are aggregated into a single "Aggregated Reward Judgement" (dark green circle 'r').
### Key Observations
* The system integrates multiple AI techniques: Monte Carlo estimation, Chain-of-Thought analysis, and code verification.
* "Consensus filtering" acts as a central hub for combining information from relative progress estimation and rationale synthesis, feeding back into training data.
* GenPRM plays multiple roles: generating solutions, verifying, and critiquing.
* The system emphasizes both individual step-by-step analysis (CoT) and programmatic verification (Code Verification) for robust rationale synthesis.
* Test-time scaling involves both verification of multiple solutions and iterative self-critique.
* The final test-time scaling aggregates multiple individual reward judgments into a single overall judgment.
* The use of `x N` in sections 5 and 6 indicates parallel processing or multiple iterations/instances.
### Interpretation
This diagram outlines a sophisticated framework for developing and evaluating a Generative Process Reward Model (GenPRM), likely in the context of automated problem-solving, particularly for tasks that require logical reasoning or code execution (e.g., math problems, programming challenges).
The system begins by generating potential solutions and estimating their quality using Monte Carlo methods (Section 1). This initial estimation, along with a "Relative Progress Estimation" (Section 2), feeds into a "Consensus filtering" mechanism. This suggests that the system aims to identify high-quality or promising solutions and their associated rationales.
The "Rationale Synthesis" (Section 3) is a critical component, demonstrating how the system generates and validates the reasoning behind a solution. It combines Chain-of-Thought analysis (a common technique in large language models for explaining reasoning) with explicit "Code Verification" and execution. The "consistent" and "conflict" arrows highlight a self-correction or refinement loop, where code output can either confirm or contradict the CoT analysis, leading to iterative improvement of the rationale. The output of this synthesis also contributes to "Consensus filtering," implying that only well-reasoned and verified rationales are used for training.
The "GenPRM Training" (Section 4) shows that the model is trained using "Data (23K)" via Supervised Fine-Tuning (SFT). Crucially, the "Consensus filtering" feeds back into this data, suggesting a self-improving loop where the model learns from its own verified rationales and progress estimations. This could imply a form of reinforcement learning from human feedback (RLHF) or self-play where the model generates its own training data.
Finally, the "Policy Model Test-Time Scaling" (Section 5) and "GenPRM Test-Time Scaling" (Section 6) illustrate how the trained GenPRM is deployed and evaluated. GenPRM can act as a "Verifier" to assess the correctness of multiple generated solutions, aiming for a correct answer and reward. It can also act as a "Critic," iteratively refining a solution through self-critique, which might lead to identifying errors. The "GenPRM Test-Time Scaling" shows a parallelized approach where multiple "analyze" and "verify" steps are performed, leading to individual reward judgments that are then aggregated. This suggests a robust evaluation strategy that averages or combines multiple independent assessments to arrive at a final, more reliable reward judgment.
In essence, the diagram describes a system that not only solves problems but also generates and verifies its own reasoning, learns from this verified reasoning, and then scales its evaluation capabilities by acting as both a verifier and a critic in a parallelized fashion. The "2/3" MC reward in Section 1, the "Yes/No" judgment in Section 3, and the `r̂t = 1` or `0` in Section 2, all point to a system designed for binary or scalar reward prediction based on complex reasoning processes.
DECODING INTELLIGENCE...