\n
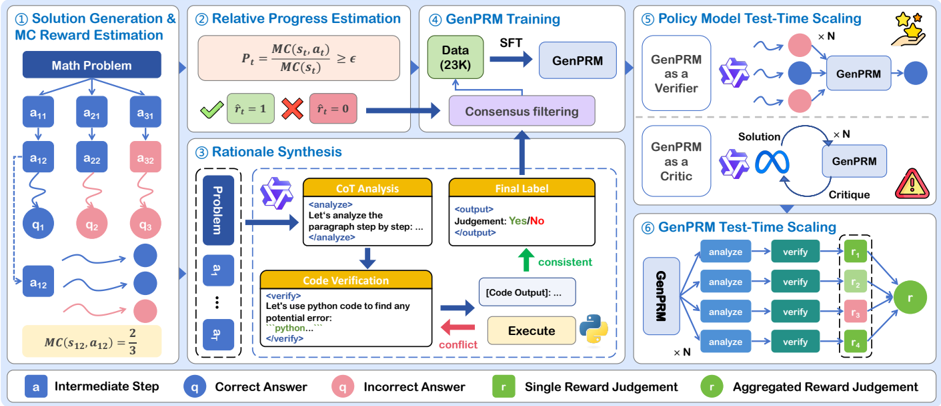
## Diagram: GenPRM System Architecture
### Overview
This diagram illustrates the architecture of the GenPRM (Generative Policy Rollout Model) system, a framework for solving math problems. The system consists of six main stages: Solution Generation & MC Reward Estimation, Relative Progress Estimation, Rationale Synthesis, GenPRM Training, Policy Model Test-Time Scaling, and GenPRM Test-Time Scaling. The diagram depicts the flow of information and processes within the system, highlighting the use of intermediate steps, correct/incorrect answers, reward judgements, and the iterative nature of the GenPRM model.
### Components/Axes
The diagram is segmented into six numbered boxes, each representing a stage in the GenPRM process. A legend at the bottom identifies key symbols:
* **a**: Intermediate Step (light blue)
* **q**: Correct Answer (green)
* **q**: Incorrect Answer (red)
* **r**: Single Reward Judgement (yellow)
* **r**: Aggregated Reward Judgement (dark green)
The diagram uses arrows to indicate the flow of information between stages. Text boxes within each stage describe the processes involved.
### Detailed Analysis or Content Details
**1. Solution Generation & MC Reward Estimation:**
* A "Math Problem" is presented.
* The problem is broken down into a series of steps represented by `a11`, `a21`, `a31`, `a12`, `a22`, `a32`, and `a13`, `a23`, `a33`. These are labeled as "Intermediate Step" (light blue).
* The steps lead to answers `q1`, `q2`, `q3`. These are labeled as "Correct Answer" (green) or "Incorrect Answer" (red).
* An equation `MC(s, a) = P = 1` and `MC(s) = z ∈` is shown, representing Monte Carlo (MC) reward estimation.
* A specific example is given: `MC(s12, a12) = 2/3`.
**2. Relative Progress Estimation:**
* The output of the previous stage is fed into this stage.
* A visual comparison is made between `f = 1` (Correct Answer - green) and `f = 0` (Incorrect Answer - red).
**3. Rationale Synthesis:**
* The "Problem" from stage 1 is input.
* A "CoT Analysis" (Chain-of-Thought Analysis) is performed, enclosed in `<analyze>` tags. The text within reads: "Let's analyze the paragraph step by step..." and closes with `</analyze>`.
* This analysis leads to a "Final Label" of "Yes/No".
* "Code Verification" is performed, enclosed in `<verify>` tags. The text within reads: "Let's use python code to find any potential error..." and closes with `</verify>`.
* The code is "Executed", resulting in "[Code Output]...".
* A comparison is made between the analysis and code execution, resulting in either "consistent" (green upward arrow) or "conflict" (red).
**4. GenPRM Training:**
* "Data (23K)" is input.
* This data is used to train "GenPRM" using "SFT" (Supervised Fine-Tuning).
* "Consensus filtering" is applied to the output of GenPRM.
**5. Policy Model Test-Time Scaling:**
* "GenPRM as a Verifier" is used to verify solutions.
* "GenPRM as a Critic" provides critiques.
* The process is repeated "x N" times, with solutions being generated, critiqued, and refined iteratively.
* A small icon of a brain with a star is present.
**6. GenPRM Test-Time Scaling:**
* "GenPRM" is used to "analyze" and "verify" solutions.
* The process is repeated "x N" times.
* The output is represented as `r1`, `r2`, `r3`, `r4`, which are "Single Reward Judgements" (yellow).
* These individual judgements are aggregated into a final "Aggregated Reward Judgement" (dark green).
### Key Observations
* The system is highly iterative, with multiple stages of verification and refinement.
* The use of both Chain-of-Thought analysis and code verification suggests a robust approach to problem-solving.
* The "x N" notation indicates that certain processes are scaled up for increased performance or reliability.
* The color-coding of answers (green for correct, red for incorrect) provides a clear visual indication of success or failure.
### Interpretation
The diagram depicts a sophisticated system for automated math problem solving. The GenPRM framework leverages a combination of generative modeling, reinforcement learning, and verification techniques to achieve high accuracy and reliability. The iterative nature of the system allows it to learn from its mistakes and improve its performance over time. The inclusion of both symbolic reasoning (CoT analysis) and computational verification (code execution) suggests a hybrid approach that combines the strengths of both methods. The scaling factor "x N" implies that the system is designed to handle complex problems efficiently. The diagram highlights the importance of reward signals (r) in guiding the learning process and ensuring that the system converges to optimal solutions. The use of consensus filtering suggests a mechanism for mitigating the effects of noisy or unreliable data. Overall, the diagram presents a compelling vision for the future of automated problem-solving.