\n
## Line Chart: ΔP vs. Layer for Different Language Models and Anchoring Methods
### Overview
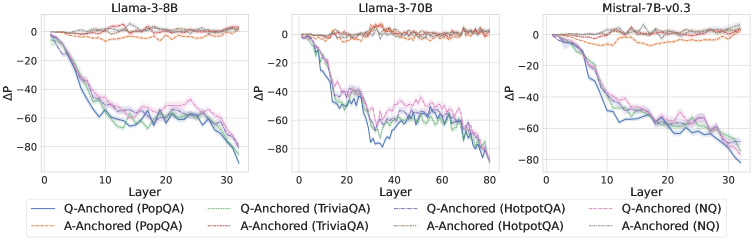
The image presents three line charts, each depicting the change in performance (ΔP) as a function of layer number for different language models: Llama-3-8B, Llama-3-70B, and Mistral-7B-v0.3. Each chart displays lines representing different anchoring methods (Q-Anchored and A-Anchored) applied to various question-answering datasets (PopQA, TriviaQA, HotpotQA, and NQ).
### Components/Axes
Each chart shares the following components:
* **X-axis:** "Layer", ranging from 0 to approximately 30 (Llama-3-8B and Mistral-7B-v0.3) or 80 (Llama-3-70B).
* **Y-axis:** "ΔP", ranging from approximately -80 to 0.
* **Legend:** Located at the bottom of each chart, identifying the different lines by anchoring method and dataset.
* Q-Anchored (PopQA) - Solid Blue Line
* Q-Anchored (TriviaQA) - Solid Green Line
* Q-Anchored (HotpotQA) - Dashed Blue Line
* Q-Anchored (NQ) - Dashed Green Line
* A-Anchored (PopQA) - Dashed Orange Line
* A-Anchored (TriviaQA) - Dashed Purple Line
* A-Anchored (HotpotQA) - Dashed Orange Line
* A-Anchored (NQ) - Dashed Purple Line
### Detailed Analysis or Content Details
**Llama-3-8B Chart:**
* **Q-Anchored (PopQA):** Starts at approximately ΔP = -2, decreases steadily to approximately ΔP = -70 at Layer 30.
* **Q-Anchored (TriviaQA):** Starts at approximately ΔP = -10, decreases to approximately ΔP = -60 at Layer 30.
* **Q-Anchored (HotpotQA):** Starts at approximately ΔP = -10, decreases to approximately ΔP = -65 at Layer 30.
* **Q-Anchored (NQ):** Starts at approximately ΔP = -15, decreases to approximately ΔP = -65 at Layer 30.
* **A-Anchored (PopQA):** Starts at approximately ΔP = -5, decreases to approximately ΔP = -60 at Layer 30.
* **A-Anchored (TriviaQA):** Starts at approximately ΔP = -10, decreases to approximately ΔP = -55 at Layer 30.
* **A-Anchored (HotpotQA):** Starts at approximately ΔP = -10, decreases to approximately ΔP = -60 at Layer 30.
* **A-Anchored (NQ):** Starts at approximately ΔP = -15, decreases to approximately ΔP = -60 at Layer 30.
**Llama-3-70B Chart:**
* **Q-Anchored (PopQA):** Starts at approximately ΔP = -2, decreases to approximately ΔP = -70 at Layer 80.
* **Q-Anchored (TriviaQA):** Starts at approximately ΔP = -10, decreases to approximately ΔP = -60 at Layer 80.
* **Q-Anchored (HotpotQA):** Starts at approximately ΔP = -10, decreases to approximately ΔP = -60 at Layer 80.
* **Q-Anchored (NQ):** Starts at approximately ΔP = -15, decreases to approximately ΔP = -60 at Layer 80.
* **A-Anchored (PopQA):** Starts at approximately ΔP = -5, decreases to approximately ΔP = -60 at Layer 80.
* **A-Anchored (TriviaQA):** Starts at approximately ΔP = -10, decreases to approximately ΔP = -55 at Layer 80.
* **A-Anchored (HotpotQA):** Starts at approximately ΔP = -10, decreases to approximately ΔP = -60 at Layer 80.
* **A-Anchored (NQ):** Starts at approximately ΔP = -15, decreases to approximately ΔP = -60 at Layer 80.
**Mistral-7B-v0.3 Chart:**
* **Q-Anchored (PopQA):** Starts at approximately ΔP = -2, decreases to approximately ΔP = -70 at Layer 30.
* **Q-Anchored (TriviaQA):** Starts at approximately ΔP = -10, decreases to approximately ΔP = -60 at Layer 30.
* **Q-Anchored (HotpotQA):** Starts at approximately ΔP = -10, decreases to approximately ΔP = -65 at Layer 30.
* **Q-Anchored (NQ):** Starts at approximately ΔP = -15, decreases to approximately ΔP = -65 at Layer 30.
* **A-Anchored (PopQA):** Starts at approximately ΔP = -5, decreases to approximately ΔP = -60 at Layer 30.
* **A-Anchored (TriviaQA):** Starts at approximately ΔP = -10, decreases to approximately ΔP = -55 at Layer 30.
* **A-Anchored (HotpotQA):** Starts at approximately ΔP = -10, decreases to approximately ΔP = -60 at Layer 30.
* **A-Anchored (NQ):** Starts at approximately ΔP = -15, decreases to approximately ΔP = -60 at Layer 30.
In all three charts, all lines generally exhibit a downward trend, indicating a decrease in ΔP as the layer number increases. The A-Anchored lines consistently appear slightly above the corresponding Q-Anchored lines for each dataset.
### Key Observations
* The performance decrease (ΔP) is more pronounced in the Llama-3-70B model, as evidenced by the steeper slopes and lower final values on the Y-axis.
* The anchoring method (Q vs. A) has a noticeable impact on ΔP, with A-Anchored generally performing better (less negative ΔP) than Q-Anchored.
* The datasets (PopQA, TriviaQA, HotpotQA, NQ) also influence ΔP, with some datasets consistently showing higher or lower values than others.
* The trends are remarkably similar across the three models, suggesting a common underlying pattern in how performance changes with layer number and anchoring method.
### Interpretation
The charts demonstrate the impact of model depth (layer number) and anchoring method on performance, as measured by ΔP. The consistent downward trend across all models suggests that increasing the number of layers beyond a certain point may lead to performance degradation. This could be due to issues like vanishing gradients or overfitting.
The superior performance of A-Anchored methods compared to Q-Anchored methods indicates that the anchoring strategy plays a crucial role in mitigating these issues. Anchoring likely helps to stabilize training and prevent the model from diverging.
The differences in ΔP across datasets suggest that the difficulty and characteristics of the question-answering task also influence the impact of model depth and anchoring. Some datasets may be more sensitive to these factors than others.
The similarity in trends across the three models (Llama-3-8B, Llama-3-70B, and Mistral-7B-v0.3) suggests that these findings are not specific to a particular model architecture or training procedure. They may represent a general phenomenon in large language models.