## Line Charts: Layer-wise ΔP for Different QA Datasets and Anchoring Methods
### Overview
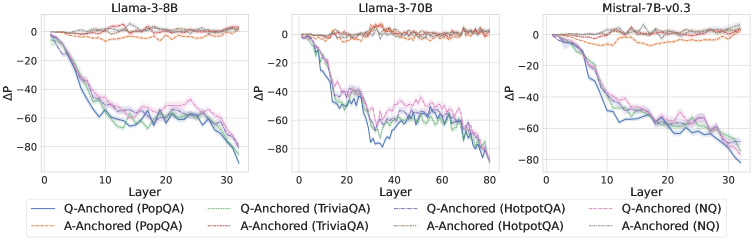
The image contains three horizontally arranged line charts, each plotting the change in probability (ΔP) across the layers of a different large language model. The charts compare the performance of two anchoring methods ("Q-Anchored" and "A-Anchored") across four question-answering (QA) datasets. The overall trend shows a significant negative ΔP for Q-Anchored methods as layer depth increases, while A-Anchored methods remain stable near zero.
### Components/Axes
* **Chart Titles (Top Center):**
* Left Chart: `Llama-3-8B`
* Middle Chart: `Llama-3-70B`
* Right Chart: `Mistral-7B-v0.3`
* **X-Axis (Bottom):**
* Label: `Layer`
* Scale (Left Chart): 0 to 30, with major ticks at 0, 10, 20, 30.
* Scale (Middle Chart): 0 to 80, with major ticks at 0, 20, 40, 60, 80.
* Scale (Right Chart): 0 to 30, with major ticks at 0, 10, 20, 30.
* **Y-Axis (Left):**
* Label: `ΔP`
* Scale (All Charts): -80 to 0, with major ticks at -80, -60, -40, -20, 0.
* **Legend (Bottom Center, spanning all charts):**
* **Q-Anchored (Solid Lines):**
* Blue: `Q-Anchored (PopQA)`
* Green: `Q-Anchored (TriviaQA)`
* Purple: `Q-Anchored (HotpotQA)`
* Pink: `Q-Anchored (NQ)`
* **A-Anchored (Dashed Lines):**
* Orange: `A-Anchored (PopQA)`
* Red: `A-Anchored (TriviaQA)`
* Brown: `A-Anchored (HotpotQA)`
* Gray: `A-Anchored (NQ)`
### Detailed Analysis
**1. Llama-3-8B (Left Chart):**
* **Q-Anchored Lines (Solid):** All four lines (blue, green, purple, pink) begin near ΔP = 0 at Layer 0. They exhibit a steep, near-parallel decline starting around Layer 2-3. By Layer 30, all have dropped to approximately ΔP = -70 to -80. The pink line (NQ) appears slightly higher (less negative) than the others between layers 10-25.
* **A-Anchored Lines (Dashed):** All four dashed lines (orange, red, brown, gray) remain tightly clustered around ΔP = 0 across all 30 layers, showing minimal fluctuation.
**2. Llama-3-70B (Middle Chart):**
* **Q-Anchored Lines (Solid):** The decline begins later, around Layer 10. The drop is more volatile, with a significant dip and partial recovery between Layers 20-40. The lowest point for most lines is around Layer 30 (ΔP ≈ -70 to -80). After Layer 40, the lines trend downward again, ending near ΔP = -80 at Layer 80. The purple line (HotpotQA) shows the most pronounced volatility.
* **A-Anchored Lines (Dashed):** Similar to the 8B model, these lines stay near ΔP = 0 with minor noise across all 80 layers.
**3. Mistral-7B-v0.3 (Right Chart):**
* **Q-Anchored Lines (Solid):** The decline starts around Layer 5. The slope is steadier and less steep than in the Llama-3-8B chart. By Layer 30, the lines converge to a range of approximately ΔP = -60 to -75. The blue line (PopQA) is consistently the lowest (most negative) from Layer 15 onward.
* **A-Anchored Lines (Dashed):** Consistent with the other models, these lines hover around ΔP = 0 for the entire layer range.
### Key Observations
1. **Anchoring Method Disparity:** There is a stark and consistent contrast between the two anchoring methods. Q-Anchored performance (ΔP) degrades severely with model depth, while A-Anchored performance is robust and unaffected by layer.
2. **Model Architecture Influence:** The layer at which the Q-Anchored decline begins and its trajectory varies by model. Llama-3-8B shows the earliest and smoothest drop. Llama-3-70B shows a delayed but more complex, volatile pattern. Mistral-7B shows an intermediate, steadier decline.
3. **Dataset Similarity:** Within each anchoring method, the four QA datasets (PopQA, TriviaQA, HotpotQA, NQ) follow very similar trajectories, suggesting the observed phenomenon is general across these datasets rather than dataset-specific.
4. **Spatial Layout:** The legend is positioned centrally below all three charts, allowing for direct color/line-style comparison across the different model panels.
### Interpretation
This data strongly suggests that the mechanism measured by ΔP (likely related to the model's internal probability assignment or knowledge retention) is highly sensitive to the anchoring strategy used during evaluation or probing.
* **Q-Anchored (Question-Anchored) Vulnerability:** The consistent negative trend indicates that as information propagates through the deeper layers of the transformer, the model's processing or representation related to the *question* context becomes progressively less aligned with the final output probability. This could imply a form of "forgetting" or a shift in representational focus away from the initial query in later layers.
* **A-Anchored (Answer-Anchored) Stability:** The flat lines near zero demonstrate that when anchored to the *answer*, the measured probability change is stable across all layers. This suggests the model's internal representation of the answer itself remains consistent and robust throughout the network depth.
* **Architectural Implications:** The differences between Llama-3 (8B vs. 70B) and Mistral suggest that model scale and architecture influence *how* and *when* this representational shift occurs, but not *whether* it occurs. The more complex pattern in the 70B model might reflect more sophisticated internal processing or routing.
* **Practical Implication:** For tasks requiring deep, layer-wise analysis of model reasoning (e.g., interpretability, probing), the choice of anchoring point (question vs. answer) is not a minor detail but a critical methodological decision that fundamentally changes the observed results. The A-Anchored method appears to provide a more stable signal for analysis across layers.