TECHNICAL ASSET FINGERPRINT
e625fbfa1eaa2d45b0730f92
Click to view fullscreen
Press ESC or click to close
FOUND IN PAPERS
EXPERT: nemotron-free VERSION 2
RUNTIME: free/nvidia/nemotron-nano-12b-v2-vl:free
INTEL_VERIFIED
## Line Chart: ΔP Across Layers for Different Models and Anchoring Methods
### Overview
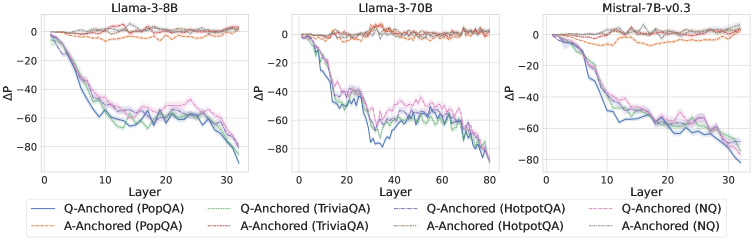
The image displays three line charts comparing the change in ΔP (ΔP) across layers for three language models: Llama-3-8B, Llama-3-70B, and Mistral-7B-v0.3. Each chart includes multiple data series representing different anchoring methods (Q-Anchored and A-Anchored) and datasets (PopQA, TriviaQA, HotpotQA, NQ). The y-axis represents ΔP (ranging from -80 to 0), and the x-axis represents layers (0 to 30 or 80, depending on the model). The charts show trends in ΔP values as layers increase, with distinct patterns for each method and dataset.
---
### Components/Axes
- **X-axis (Layer)**:
- Llama-3-8B: 0 to 30 (increments of 10)
- Llama-3-70B: 0 to 80 (increments of 20)
- Mistral-7B-v0.3: 0 to 30 (increments of 10)
- **Y-axis (ΔP)**:
- Range: -80 to 0 (increments of 20)
- Labels: "ΔP" (delta P)
- **Legends**:
- **Llama-3-8B**:
- Solid blue: Q-Anchored (PopQA)
- Dashed orange: A-Anchored (PopQA)
- Solid green: Q-Anchored (TriviaQA)
- Dashed red: A-Anchored (TriviaQA)
- Solid purple: Q-Anchored (HotpotQA)
- Dashed pink: A-Anchored (HotpotQA)
- Solid gray: Q-Anchored (NQ)
- Dashed brown: A-Anchored (NQ)
- **Llama-3-70B**:
- Solid blue: Q-Anchored (PopQA)
- Dashed orange: A-Anchored (PopQA)
- Solid green: Q-Anchored (TriviaQA)
- Dashed red: A-Anchored (TriviaQA)
- Solid purple: Q-Anchored (HotpotQA)
- Dashed pink: A-Anchored (HotpotQA)
- Solid gray: Q-Anchored (NQ)
- Dashed brown: A-Anchored (NQ)
- **Mistral-7B-v0.3**:
- Solid blue: Q-Anchored (PopQA)
- Dashed orange: A-Anchored (PopQA)
- Solid green: Q-Anchored (TriviaQA)
- Dashed red: A-Anchored (TriviaQA)
- Solid purple: Q-Anchored (HotpotQA)
- Dashed pink: A-Anchored (HotpotQA)
- Solid gray: Q-Anchored (NQ)
- Dashed brown: A-Anchored (NQ)
---
### Detailed Analysis
#### Llama-3-8B Panel
- **Q-Anchored (PopQA)**: Solid blue line starts near 0 and declines sharply to ~-80 by layer 30, with minor fluctuations.
- **A-Anchored (PopQA)**: Dashed orange line remains near 0 throughout, showing minimal change.
- **Q-Anchored (TriviaQA)**: Solid green line declines gradually to ~-60 by layer 30.
- **A-Anchored (TriviaQA)**: Dashed red line shows a slight decline to ~-40 by layer 30.
- **Q-Anchored (HotpotQA)**: Solid purple line declines to ~-70 by layer 30.
- **A-Anchored (HotpotQA)**: Dashed pink line declines to ~-50 by layer 30.
- **Q-Anchored (NQ)**: Solid gray line declines to ~-75 by layer 30.
- **A-Anchored (NQ)**: Dashed brown line declines to ~-60 by layer 30.
#### Llama-3-70B Panel
- **Q-Anchored (PopQA)**: Solid blue line starts near 0 and declines to ~-80 by layer 80, with oscillations.
- **A-Anchored (PopQA)**: Dashed orange line remains near 0, showing no significant change.
- **Q-Anchored (TriviaQA)**: Solid green line declines to ~-60 by layer 80.
- **A-Anchored (TriviaQA)**: Dashed red line declines to ~-40 by layer 80.
- **Q-Anchored (HotpotQA)**: Solid purple line declines to ~-70 by layer 80.
- **A-Anchored (HotpotQA)**: Dashed pink line declines to ~-50 by layer 80.
- **Q-Anchored (NQ)**: Solid gray line declines to ~-75 by layer 80.
- **A-Anchored (NQ)**: Dashed brown line declines to ~-60 by layer 80.
#### Mistral-7B-v0.3 Panel
- **Q-Anchored (PopQA)**: Solid blue line starts near 0 and declines to ~-80 by layer 30.
- **A-Anchored (PopQA)**: Dashed orange line remains near 0.
- **Q-Anchored (TriviaQA)**: Solid green line declines to ~-60 by layer 30.
- **A-Anchored (TriviaQA)**: Dashed red line declines to ~-40 by layer 30.
- **Q-Anchored (HotpotQA)**: Solid purple line declines to ~-70 by layer 30.
- **A-Anchored (HotpotQA)**: Dashed pink line declines to ~-50 by layer 30.
- **Q-Anchored (NQ)**: Solid gray line declines to ~-75 by layer 30.
- **A-Anchored (NQ)**: Dashed brown line declines to ~-60 by layer 30.
---
### Key Observations
1. **Q-Anchored vs. A-Anchored**:
- Q-Anchored methods (solid lines) consistently show steeper declines in ΔP compared to A-Anchored methods (dashed lines) across all models and datasets.
- A-Anchored methods (dashed lines) exhibit minimal or no change in ΔP, remaining close to 0.
2. **Dataset-Specific Trends**:
- **PopQA**: Q-Anchored methods show the most significant ΔP decline, while A-Anchored methods remain stable.
- **TriviaQA**: Q-Anchored methods decline moderately, while A-Anchored methods show slight declines.
- **HotpotQA**: Q-Anchored methods decline sharply, while A-Anchored methods show moderate declines.
- **NQ**: Q-Anchored methods decline steeply, while A-Anchored methods show moderate declines.
3. **Model-Specific Variations**:
- **Llama-3-8B**: All Q-Anchored methods show steep declines, with PopQA and NQ having the most pronounced drops.
- **Llama-3-70B**: Similar trends to Llama-3-8B, but with more oscillations in Q-Anchored lines.
- **Mistral-7B-v0.3**: Q-Anchored methods show steep declines, while A-Anchored methods remain stable.
4. **Fluctuations**:
- Some lines (e.g., Q-Anchored (TriviaQA) in Llama-3-70B) exhibit oscillations, suggesting variability in ΔP across layers.
---
### Interpretation
The data suggests that **Q-Anchored methods** (solid lines) are more sensitive to layer changes, resulting in larger ΔP declines compared to **A-Anchored methods** (dashed lines), which remain relatively stable. This implies that Q-Anchored approaches may be more effective or impactful in certain contexts, depending on the dataset.
- **Dataset Influence**:
- PopQA and NQ datasets show the most significant ΔP declines for Q-Anchored methods, indicating these datasets may be more challenging or require greater adjustments across layers.
- TriviaQA and HotpotQA datasets exhibit moderate declines, suggesting they are less sensitive to anchoring methods.
- **Model Size**:
- Llama-3-70B (larger model) shows more oscillations in Q-Anchored lines, possibly due to increased complexity or parameter interactions.
- Mistral-7B-v0.3 (smaller model) exhibits smoother trends, suggesting simpler layer dynamics.
- **Anomalies**:
- The A-Anchored (PopQA) lines in all panels remain nearly flat, indicating minimal impact of anchoring on ΔP for this dataset.
- Oscillations in Q-Anchored lines (e.g., Llama-3-70B) may reflect model-specific architectural or training characteristics.
This analysis highlights the importance of anchoring methods and dataset selection in shaping ΔP trends, which could inform model optimization or evaluation strategies.
DECODING INTELLIGENCE...