## Scatter Plot: Delta f vs n
### Overview
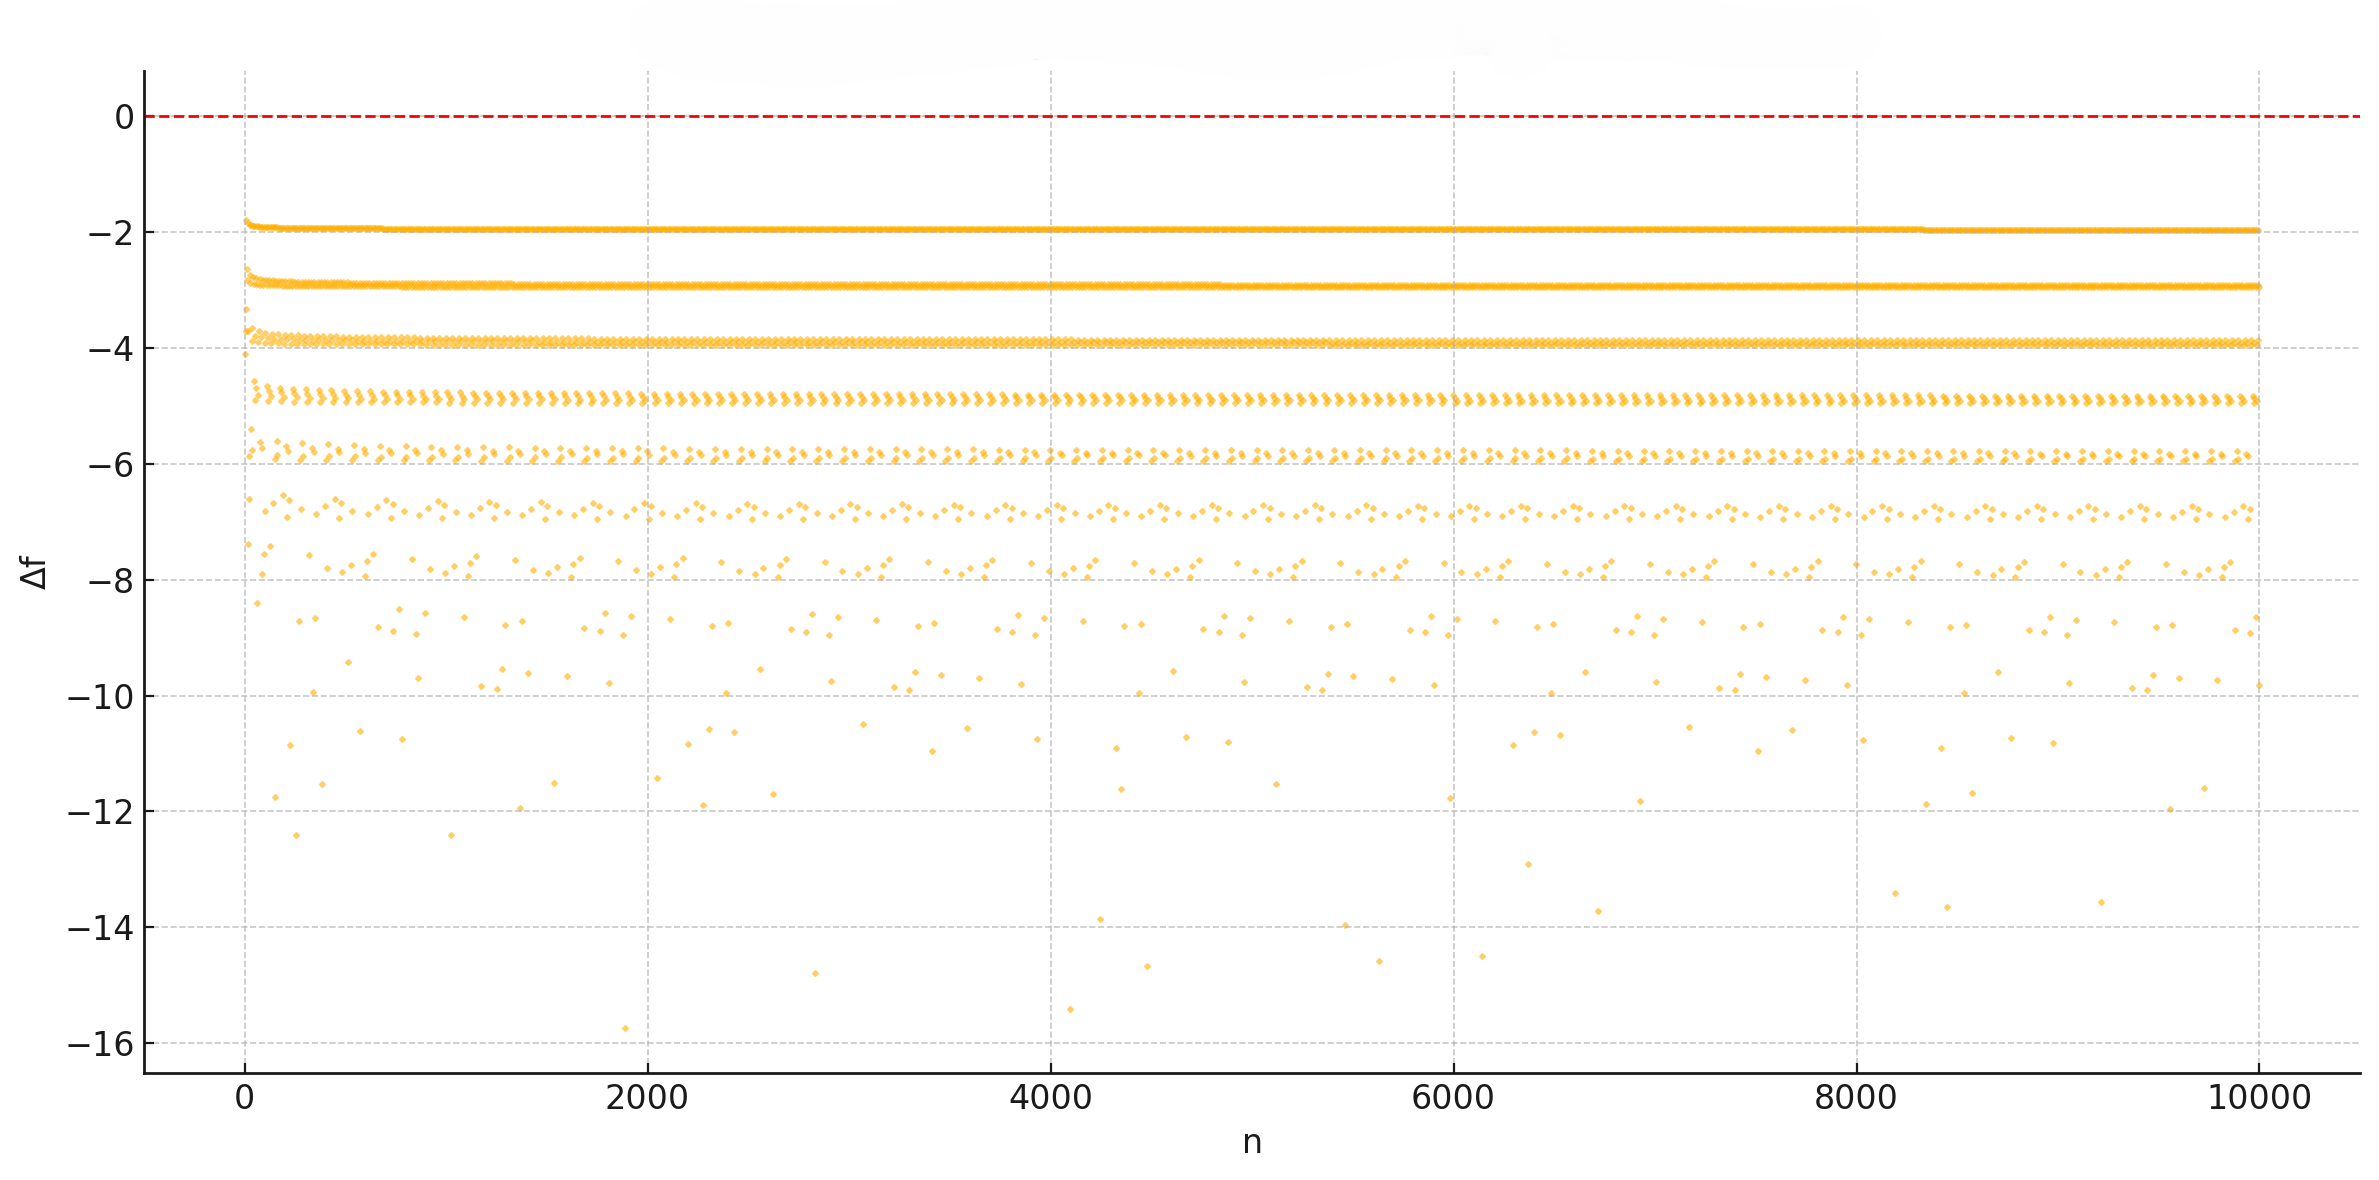
The image is a scatter plot showing the relationship between two variables, delta f (Δf) on the y-axis and n on the x-axis. The plot contains multiple data series, all represented by orange points. The data series appear to converge to distinct horizontal lines as 'n' increases. A red dashed line is present at y=0.
### Components/Axes
* **X-axis:** Labeled "n", with a scale from 0 to 10000, incrementing by 2000.
* **Y-axis:** Labeled "Δf", with a scale from -16 to 0, incrementing by 2.
* **Data Series:** Multiple data series are plotted, all in orange.
* **Reference Line:** A horizontal dashed red line is present at Δf = 0.
* **Grid:** The plot has a light gray grid.
### Detailed Analysis
The plot contains several distinct data series, all represented by orange points. Each series appears to converge to a specific horizontal level as 'n' increases.
* **Series 1 (Topmost):** This series starts around Δf = -2 and quickly converges to a horizontal line at approximately Δf = -2.
* **Series 2:** This series starts around Δf = -3 and converges to a horizontal line at approximately Δf = -3.
* **Series 3:** This series starts around Δf = -4 and converges to a horizontal line at approximately Δf = -4.
* **Series 4:** This series starts around Δf = -5 and converges to a horizontal line at approximately Δf = -5.
* **Series 5:** This series starts around Δf = -6 and converges to a horizontal line at approximately Δf = -6.
* **Series 6:** This series starts around Δf = -7 and converges to a horizontal line at approximately Δf = -7.
* **Series 7:** This series starts around Δf = -8 and converges to a horizontal line at approximately Δf = -8.
* **Series 8:** This series starts around Δf = -9 and converges to a horizontal line at approximately Δf = -9.
* **Series 9:** This series starts around Δf = -10 and converges to a horizontal line at approximately Δf = -10.
* **Series 10:** This series starts around Δf = -11 and converges to a horizontal line at approximately Δf = -11.
* **Series 11:** This series starts around Δf = -12 and converges to a horizontal line at approximately Δf = -12.
* **Series 12:** This series starts around Δf = -13 and converges to a horizontal line at approximately Δf = -13.
* **Series 13:** This series starts around Δf = -14 and converges to a horizontal line at approximately Δf = -14.
* **Series 14:** This series starts around Δf = -15 and converges to a horizontal line at approximately Δf = -15.
### Key Observations
* The data series exhibit a clear trend of converging to distinct horizontal levels as 'n' increases.
* The horizontal levels are spaced approximately one unit apart on the Δf axis.
* The convergence appears to happen more rapidly for the series closer to Δf = 0.
* The red dashed line at Δf = 0 serves as a reference point.
### Interpretation
The plot suggests that as 'n' increases, the value of Δf for each series approaches a specific, stable value. The distinct horizontal levels indicate that the system being modeled may have discrete states or stable configurations. The rapid convergence for series closer to Δf = 0 might indicate a stronger stabilizing force or faster relaxation towards equilibrium for those states. The plot visualizes the relationship between 'n' and Δf, demonstrating how 'n' influences the stability or convergence of Δf towards specific values.