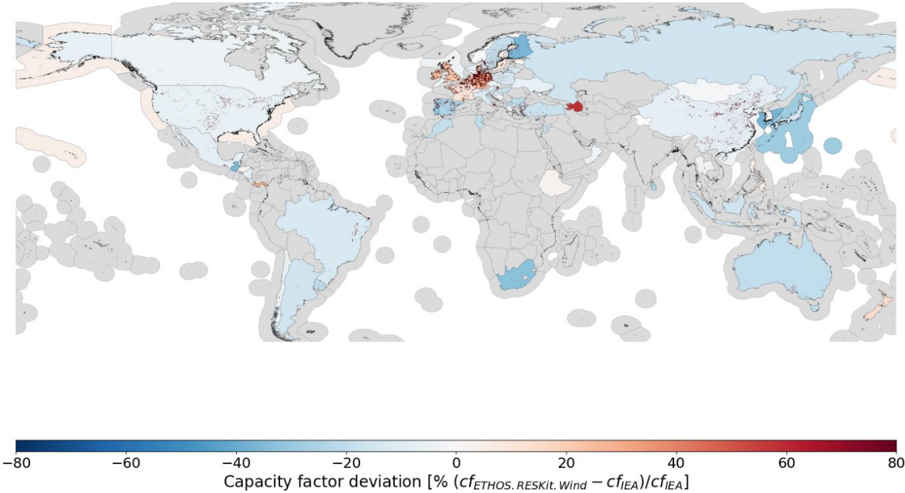
## Heatmap: Capacity Factor Deviation of Wind Energy
### Overview
The image is a world map heatmap illustrating the capacity factor deviation of wind energy, comparing the capacity factor from ETHOS.RESKit.Wind to the capacity factor from IEA (International Energy Agency). The color scale ranges from dark blue (negative deviation, -80%) to dark red (positive deviation, +80%). Grey areas indicate regions where data is unavailable or not applicable.
### Components/Axes
* **Map:** World map projection.
* **Color Scale (Legend):** Located at the bottom of the image.
* Dark Blue: -80% Capacity factor deviation
* Light Blue: -40% Capacity factor deviation
* Very Light Blue: -20% Capacity factor deviation
* White: 0% Capacity factor deviation
* Light Red: 20% Capacity factor deviation
* Red: 40% Capacity factor deviation
* Dark Red: 60% Capacity factor deviation
* Very Dark Red: 80% Capacity factor deviation
* **Title (Legend):** "Capacity factor deviation [% (cfETHOS.RESKit.Wind - cfIEA)/cfIEA]"
### Detailed Analysis
* **Europe:** Shows a significant positive deviation (red and dark red) in capacity factor, particularly in the UK and surrounding areas. The deviation appears to be in the range of 20% to 80%.
* **North America:** Predominantly shows a negative deviation (blue shades), especially in the central and western regions. The deviation appears to be in the range of -20% to -60%.
* **South America:** Shows a mix of positive and negative deviations, with some areas in Argentina and Chile showing negative deviations (light blue).
* **Asia:** Exhibits a mix of positive and negative deviations. China shows a significant area of negative deviation (blue shades) along its eastern coast.
* **Africa:** Shows a mix of positive and negative deviations, with South Africa showing a negative deviation (light blue).
* **Australia:** Shows a negative deviation (light blue).
* **Oceans:** The oceans surrounding the continents are colored in light grey, indicating no data or irrelevant data.
### Key Observations
* Europe, particularly the UK, shows the most significant positive deviation in wind energy capacity factor.
* North America, especially the central and western regions, shows a significant negative deviation.
* Many coastal regions show deviations, likely due to offshore wind resources.
### Interpretation
The heatmap suggests that the ETHOS.RESKit.Wind model predicts significantly higher wind energy capacity factors in Europe compared to the IEA data. Conversely, in North America, the ETHOS.RESKit.Wind model predicts lower capacity factors. These differences could be due to variations in modeling methodologies, data sources, or assumptions about wind resource availability and turbine technology. The map highlights regions where further investigation into the accuracy and reliability of wind energy capacity factor predictions is warranted. The differences in capacity factor deviation could have significant implications for wind energy project planning, investment decisions, and grid integration strategies.