## World Map Heatmap: Capacity Factor Deviation for Wind Energy
### Overview
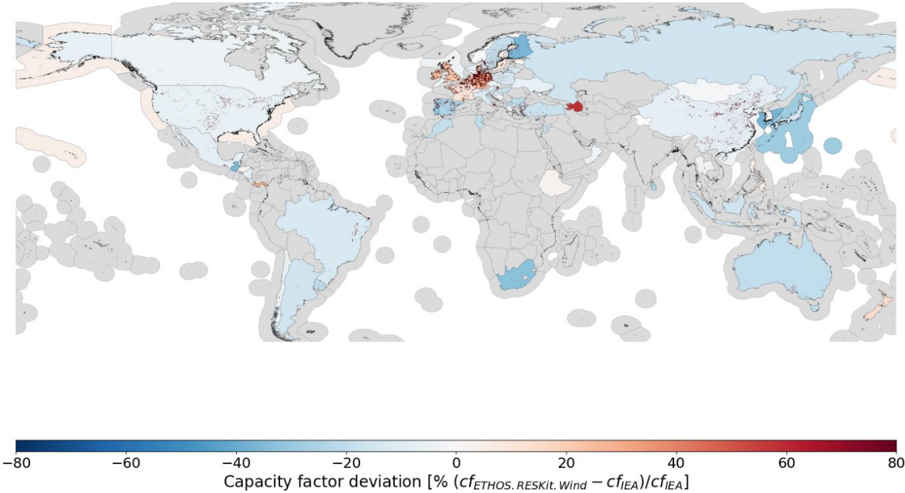
The image is a world map choropleth (heatmap) displaying the percentage deviation in wind capacity factor estimates between two datasets: `ETHOS.RESKit.Wind` and `IEA`. The map uses a diverging color scale to show where one dataset's estimate is higher or lower than the other's across different global regions.
### Components/Axes
* **Map Type:** A flat projection world map showing continental landmasses and major islands.
* **Color Scale/Legend:** Located at the bottom center of the image.
* **Title:** `Capacity factor deviation [%] (cf_ETHOS.RESKit.Wind - cf_IEA)/cf_IEA`
* **Scale:** A horizontal gradient bar ranging from **-80** to **80**.
* **Color Mapping:**
* **Deep Blue:** -80% (indicating `cf_ETHOS` is 80% lower than `cf_IEA`).
* **Light Blue:** Negative values (e.g., -60, -40, -20).
* **White/Neutral:** 0% (no deviation).
* **Light Red/Pink:** Positive values (e.g., 20, 40).
* **Deep Red:** +80% (indicating `cf_ETHOS` is 80% higher than `cf_IEA`).
* **Spatial Elements:**
* **Landmasses:** Countries and regions are filled with colors from the scale.
* **Ocean/Background:** A uniform light gray color.
* **Offshore Areas:** Indicated by light blue circular/elliptical patches surrounding coastlines, also colored according to the deviation scale.
### Detailed Analysis
The map visualizes the formula `(cf_ETHOS.RESKit.Wind - cf_IEA) / cf_IEA` expressed as a percentage. This represents the relative difference between the ETHOS wind capacity factor and the IEA wind capacity factor.
**Spatial Distribution of Data:**
* **Strong Positive Deviation (Red, ~+40% to +80%):** Concentrated in **Northern and Western Europe**. The most intense red appears over the **North Sea region**, including parts of the United Kingdom, Norway, Denmark, Germany, and the Netherlands. A distinct red patch is also visible over the **Caspian Sea region**.
* **Moderate Positive Deviation (Light Red/Pink, ~+20% to +40%):** Scattered areas in **Europe**, parts of the **eastern United States**, and small regions in **South America** (e.g., southern Brazil/Uruguay area).
* **Neutral to Slight Negative Deviation (White to Light Blue, ~0% to -20%):** Covers large portions of **North America** (central and western US, Canada), **Russia**, **Central Asia**, **China**, **Australia**, and **South America** (e.g., Argentina, Chile).
* **Moderate Negative Deviation (Blue, ~-20% to -60%):** Visible in parts of **East Asia** (coastal China, Korea, Japan), **Southeast Asia**, **South Africa**, and **New Zealand**.
* **Strong Negative Deviation (Deep Blue, ~-60% to -80%):** Not prominently visible on major landmasses in this view. The deepest blues are present in some **offshore patches** and possibly very small, indistinct regions.
**Legend and Label Transcription:**
* **Legend Title:** `Capacity factor deviation [%] (cf_ETHOS.RESKit.Wind - cf_IEA)/cf_IEA`
* **Scale Markers:** `-80`, `-60`, `-40`, `-20`, `0`, `20`, `40`, `60`, `80`.
### Key Observations
1. **Regional Clustering:** Deviations are not random but show strong regional patterns. Europe is a major hotspot for positive deviation, while East Asia shows a tendency toward negative deviation.
2. **Offshore Data:** The map includes data for offshore wind resources, represented by the colored patches in the oceans adjacent to coastlines.
3. **Magnitude of Deviation:** The scale is broad (-80% to +80%), indicating significant disagreement between the two datasets in certain locations. The most extreme differences are concentrated in the North Sea.
4. **Data Coverage:** The map provides global coverage, but the intensity of color (and thus the magnitude of deviation) is most pronounced in the Northern Hemisphere, particularly around Europe and East Asia.
### Interpretation
This map is a comparative analysis tool for wind energy resource assessment. It highlights geographical discrepancies between the `ETHOS.RESKit.Wind` model/dataset and the `IEA` (International Energy Agency) dataset.
* **What it Suggests:** The data suggests systematic, region-specific differences in how wind capacity factors are calculated or estimated by these two sources. The strong positive deviation in the North Sea implies that the ETHOS model estimates significantly higher wind power generation potential in this key region compared to the IEA's figures. Conversely, the negative deviations in East Asia suggest ETHOS estimates are lower than IEA's there.
* **Why it Matters:** Such discrepancies are critical for energy planners, investors, and policymakers. Overestimation (positive deviation) could lead to over-investment and grid integration challenges, while underestimation (negative deviation) could mean missed opportunities. The map pinpoints where these uncertainties are greatest, guiding further validation studies.
* **Underlying Factors:** The patterns could stem from differences in underlying wind speed data, turbine technology assumptions, loss factors, or the temporal resolution of the models used by ETHOS and the IEA. The concentration in Europe may relate to the availability of higher-resolution or more recent observational data used by one of the models.
* **Anomaly/Notable Point:** The stark contrast between Europe (strongly positive) and neighboring regions like North Africa (neutral/slightly negative) or Eastern Europe (less positive) is notable. It suggests the deviation is not merely a function of latitude or general climate zone but may be tied to specific regional modeling approaches or data inputs focused on European offshore wind.