# Technical Document Extraction: Box Plot of Average Sentiment by Score
## 1. Labels and Axis Titles
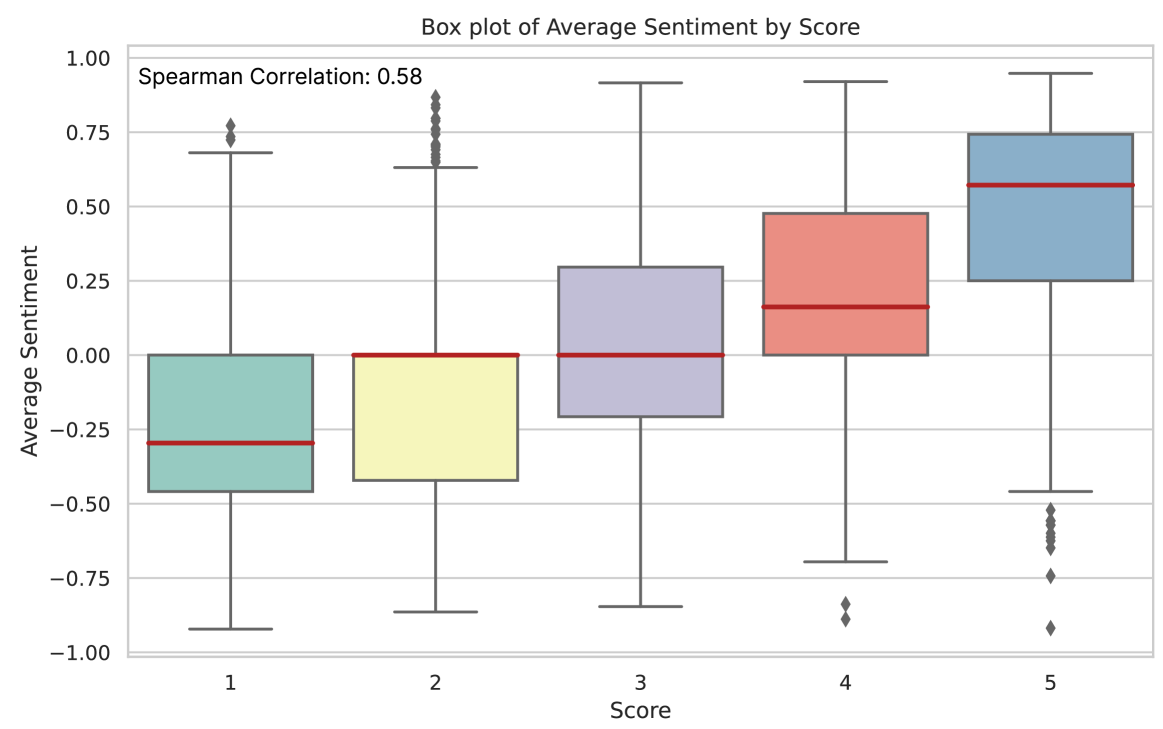
- **Title**: "Box plot of Average Sentiment by Score"
- **Y-Axis Label**: "Average Sentiment" (range: -1.00 to 1.00)
- **X-Axis Label**: "Score" (categories: 1, 2, 3, 4, 5)
- **Spearman Correlation**: 0.58 (annotated in the title)
## 2. Legend and Color Mapping
- **Legend Placement**: Top-right corner
- **Color-Score Mapping**:
- **Teal (#008080)**: Score 1
- **Yellow (#FFFF00)**: Score 2
- **Purple (#800080)**: Score 3
- **Red (#FF0000)**: Score 4
- **Blue (#0000FF)**: Score 5
## 3. Box Plot Components
### Score 1 (Teal)
- **Median**: -0.25
- **Interquartile Range (IQR)**: -0.50 to 0.00
- **Whiskers**: -0.90 to 0.75
- **Outliers**: 0.70, 0.75
### Score 2 (Yellow)
- **Median**: 0.00
- **IQR**: -0.50 to 0.25
- **Whiskers**: -0.90 to 0.80
- **Outliers**: 0.70, 0.75
### Score 3 (Purple)
- **Median**: 0.00
- **IQR**: -0.25 to 0.25
- **Whiskers**: -0.90 to 0.90
- **Outliers**: None
### Score 4 (Red)
- **Median**: 0.20
- **IQR**: 0.00 to 0.50
- **Whiskers**: -0.80 to 0.90
- **Outliers**: -0.85, -0.80
### Score 5 (Blue)
- **Median**: 0.60
- **IQR**: 0.25 to 0.75
- **Whiskers**: -0.90 to 0.95
- **Outliers**: -0.95, -0.85, -0.75, -0.70
## 4. Key Trends
1. **Negative Sentiment Dominance**: Scores 1 and 2 exhibit medians below zero (-0.25 and 0.00, respectively).
2. **Positive Sentiment Shift**: Scores 4 and 5 show medians above zero (0.20 and 0.60).
3. **Increasing Variability**: The spread (IQR) widens from Score 1 to Score 5.
4. **Outlier Distribution**: Outliers are most frequent in Scores 1, 2, and 5, with extreme values near -1.00 and 1.00.
## 5. Spatial Grounding
- **Legend**: Top-right corner (confirmed color-score alignment).
- **Data Point Verification**:
- Score 5 outliers (-0.95, -0.85, -0.75, -0.70) match the blue box plot.
- Score 1 outliers (0.70, 0.75) align with the teal box plot.
## 6. Trend Verification
- **Score 1**: Median at -0.25, with outliers extending to 0.75 (upward trend in variability).
- **Score 2**: Median at 0.00, with outliers reaching 0.80 (moderate spread).
- **Score 3**: Symmetrical distribution around 0.00, no outliers.
- **Score 4**: Median at 0.20, with outliers dipping to -0.85 (asymmetric spread).
- **Score 5**: Highest median (0.60) and widest IQR, indicating strong positive sentiment with variability.
## 7. Component Isolation
- **Header**: Title and Spearman correlation (0.58).
- **Main Chart**: Five box plots (Scores 1–5) with distinct colors and medians.
- **Footer**: No explicit footer content.
## 8. Data Table Reconstruction
No explicit data table is present. Box plot components (median, IQR, whiskers, outliers) are derived visually.
## 9. Final Notes
- **Language**: All text is in English.
- **Critical Data Points**:
- Spearman correlation (0.58) indicates moderate positive association between scores and sentiment.
- Score 5 demonstrates the strongest positive sentiment (median: 0.60).
- Score 1 exhibits the most negative median (-0.25) with significant outliers.