## Line Graph: Layer Index vs. Numerical Values
### Overview
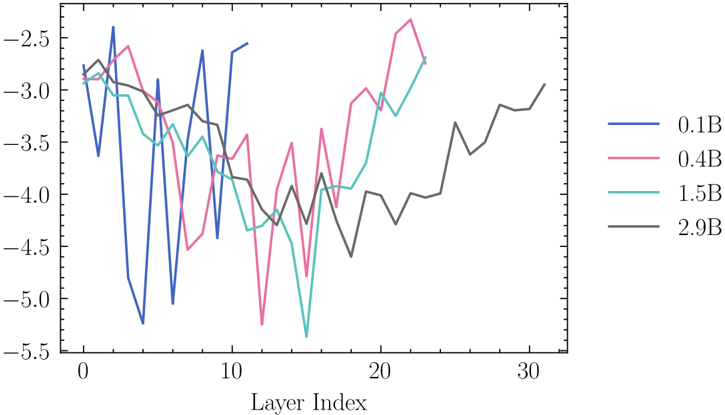
The image depicts a line graph comparing four data series across a layer index range (0–30). The y-axis represents numerical values (approximately -5.5 to -2.5), while the x-axis represents layer indices. Four distinct lines, differentiated by color and labeled with "B" values (0.1B, 0.4B, 1.5B, 2.9B), show fluctuating trends with sharp peaks and troughs.
### Components/Axes
- **X-axis (Layer Index)**: Labeled "Layer Index," spanning 0 to 30 in increments of 10.
- **Y-axis (Numerical Values)**: Labeled with values from -5.5 to -2.5 in increments of 0.5.
- **Legend**: Positioned on the right, mapping colors to B values:
- Blue: 0.1B
- Pink: 0.4B
- Teal: 1.5B
- Black: 2.9B
### Detailed Analysis
1. **0.1B (Blue Line)**:
- Starts near -2.8 at layer 0, plunges to -5.0 at layer 5, then oscillates between -3.5 and -4.5.
- Sharpest dip occurs between layers 5–10, followed by erratic fluctuations.
2. **0.4B (Pink Line)**:
- Begins at -2.9, drops to -4.0 at layer 5, then fluctuates between -3.0 and -4.5.
- Shows a pronounced peak at layer 20 (~ -2.5) before declining.
3. **1.5B (Teal Line)**:
- Starts at -3.2, dips to -4.5 at layer 10, then stabilizes between -3.0 and -4.0.
- Sharpest drop occurs between layers 10–15.
4. **2.9B (Black Line)**:
- Most stable series, starting at -2.8 and gradually increasing to -2.5 by layer 30.
- Minimal fluctuations compared to other lines.
### Key Observations
- **Volatility Correlation**: Lower B values (0.1B, 0.4B) exhibit greater volatility, with sharper dips and peaks.
- **Stability Threshold**: The 2.9B line (highest B value) shows the least fluctuation, suggesting a correlation between B magnitude and stability.
- **Critical Dips**: All lines except 2.9B experience significant drops between layers 5–15, potentially indicating a shared external factor.
- **Recovery Patterns**: Lines recover partially after dips, but none fully return to initial values, implying cumulative effects.
### Interpretation
The data suggests that higher B values (e.g., 2.9B) correlate with greater stability in layer index measurements, while lower B values (e.g., 0.1B) are more sensitive to external influences, causing erratic fluctuations. The sharp dips across all series between layers 5–15 may indicate a systemic event or threshold affecting all conditions. The gradual recovery in higher B values implies resilience or compensatory mechanisms absent in lower B scenarios. This could reflect a physical, biological, or computational system where B represents a parameter (e.g., resource allocation, energy input) modulating system behavior.