## Line Graph: Validation Loss vs Training Steps with/without QK-Clip
### Overview
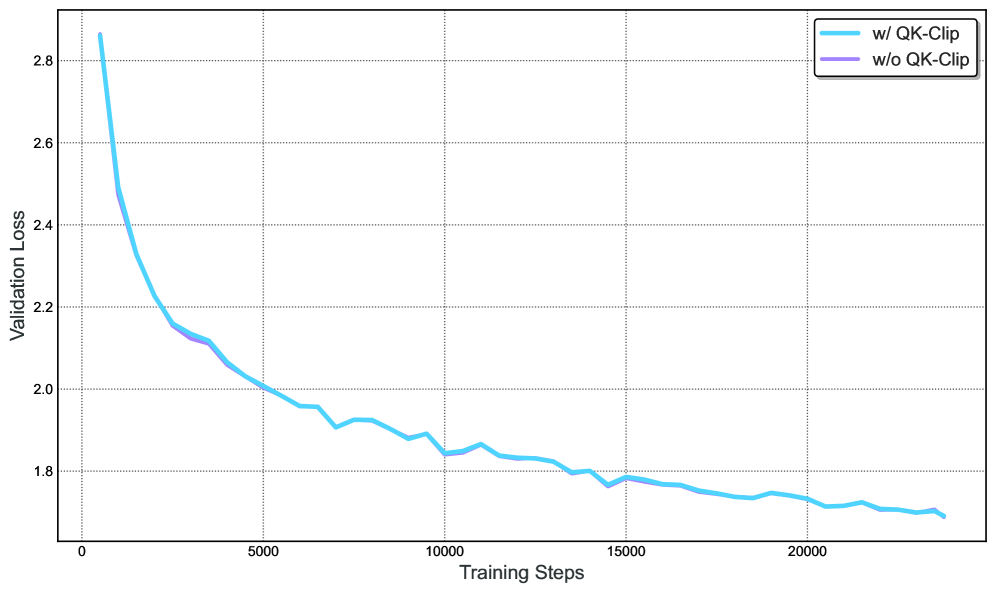
The image shows a line graph comparing validation loss over training steps for two scenarios: with QK-Clip (blue line) and without QK-Clip (purple line). The graph spans 20,000 training steps, with validation loss decreasing over time for both cases, but at different rates.
### Components/Axes
- **X-axis**: Training Steps (0 to 20,000, labeled "Training Steps")
- **Y-axis**: Validation Loss (1.7 to 2.8, labeled "Validation Loss")
- **Legend**: Located in the top-right corner, with:
- Blue line: "w/ QK-Clip"
- Purple line: "w/o QK-Clip"
### Detailed Analysis
1. **Initial Divergence (0–5,000 steps)**:
- At 0 steps:
- w/ QK-Clip: ~2.85
- w/o QK-Clip: ~2.45
- At 5,000 steps:
- w/ QK-Clip: ~2.0
- w/o QK-Clip: ~2.1
2. **Mid-Training (5,000–15,000 steps)**:
- w/ QK-Clip declines steadily from 2.0 to ~1.78.
- w/o QK-Clip declines more gradually from 2.1 to ~1.77.
3. **Late Training (15,000–20,000 steps)**:
- Both lines plateau near 1.7–1.8, with w/ QK-Clip slightly lower (~1.72 vs. ~1.71).
### Key Observations
- **Initial Performance Gap**: w/ QK-Clip starts with significantly higher validation loss (~2.85 vs. ~2.45) but improves faster.
- **Convergence**: By 10,000 steps, the gap narrows to ~0.02 (1.85 vs. 1.83).
- **Final Stability**: Both approaches stabilize near 1.7–1.8, but w/ QK-Clip maintains a marginal advantage.
### Interpretation
The data suggests that QK-Clip accelerates validation loss reduction in early training stages, likely due to improved optimization or regularization. However, its impact diminishes over time as both methods converge to similar performance levels. This implies QK-Clip is most beneficial during initial training phases, where it mitigates overfitting or instability. The marginal final difference (~0.01) indicates diminishing returns after ~15,000 steps, raising questions about computational cost-effectiveness for prolonged training.