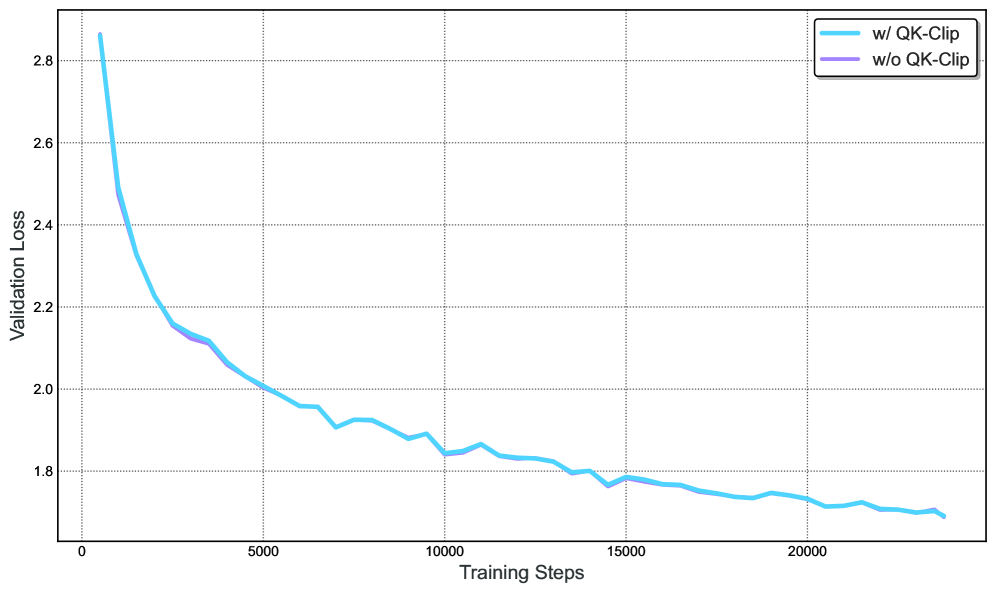
## Line Chart: Validation Loss vs. Training Steps
### Overview
The image is a line chart comparing the validation loss during training with and without QK-Clip. The x-axis represents training steps, and the y-axis represents validation loss. The chart shows how the validation loss decreases as the training progresses.
### Components/Axes
* **X-axis:** Training Steps, ranging from 0 to 20000, with increments of 5000.
* **Y-axis:** Validation Loss, ranging from 1.8 to 2.8, with increments of 0.2.
* **Legend (Top-Right):**
* Light Blue: w/ QK-Clip
* Light Purple: w/o QK-Clip
### Detailed Analysis
* **Light Blue Line (w/ QK-Clip):**
* Trend: The line slopes downward, indicating a decrease in validation loss as training steps increase.
* Starting Point: Approximately 2.85 at 0 training steps.
* At 5000 Training Steps: Approximately 2.0
* At 10000 Training Steps: Approximately 1.85
* At 15000 Training Steps: Approximately 1.78
* At 20000 Training Steps: Approximately 1.72
* **Light Purple Line (w/o QK-Clip):**
* Trend: The line slopes downward, similar to the "w/ QK-Clip" line, indicating a decrease in validation loss as training steps increase.
* Starting Point: Approximately 2.85 at 0 training steps.
* From 0 to approximately 4000 training steps, the purple line is nearly identical to the light blue line.
* At 5000 Training Steps: Approximately 2.1
* At 10000 Training Steps: Approximately 1.85
* At 15000 Training Steps: Approximately 1.78
* At 20000 Training Steps: Approximately 1.72
### Key Observations
* Both lines show a decreasing trend in validation loss as training steps increase.
* The "w/ QK-Clip" line (light blue) and "w/o QK-Clip" line (light purple) are very close to each other, especially after approximately 4000 training steps.
* The validation loss decreases rapidly in the initial training steps (0-5000) and then plateaus.
### Interpretation
The chart suggests that using QK-Clip has a minimal impact on the validation loss during training. Both models, with and without QK-Clip, exhibit similar performance in terms of validation loss. The rapid decrease in validation loss at the beginning indicates that the model learns quickly initially, and the plateau suggests that the model's learning rate slows down as it converges. The close proximity of the two lines implies that QK-Clip does not significantly affect the model's ability to generalize to the validation set.