## Time Series Chart: Accelerometer Data During Various Activities
### Overview
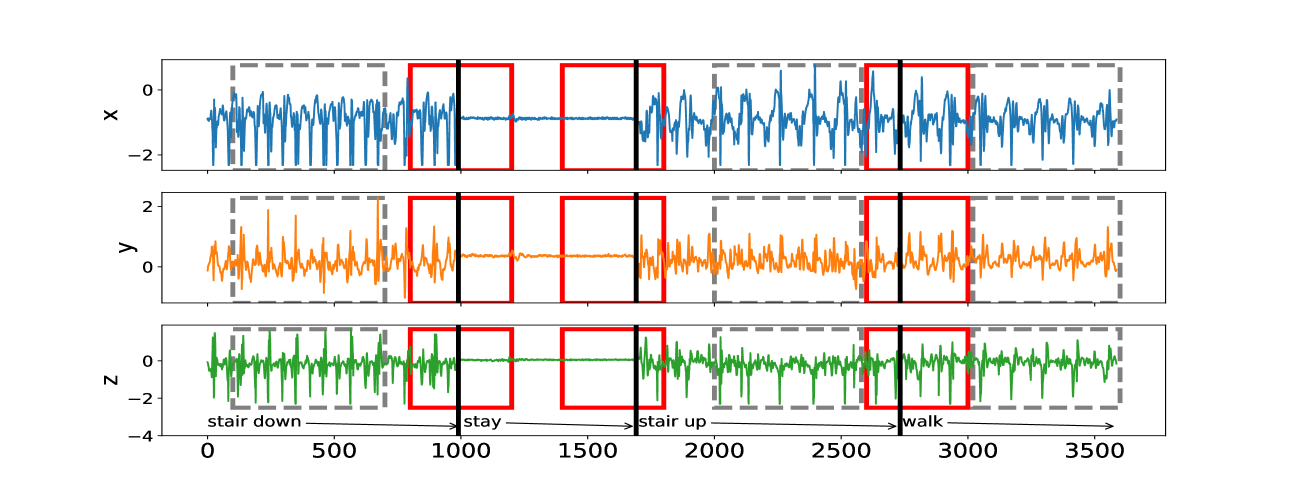
The image presents three time series plots, each representing accelerometer data along the x, y, and z axes. The data is segmented into different activities: stair descent, stationary periods, stair ascent, and walking. The x-axis represents time, ranging from 0 to 3500 units. The plots are annotated with dashed gray boxes and solid red boxes to highlight specific activity intervals.
### Components/Axes
* **Y-axes:**
* Top plot: Labeled "x", ranges from approximately -2 to 0.
* Middle plot: Labeled "y", ranges from approximately 0 to 2.
* Bottom plot: Labeled "z", ranges from approximately -4 to 0.
* **X-axis:** Shared across all three plots, ranging from 0 to 3500. Axis markers are present at 0, 500, 1000, 1500, 2000, 2500, 3000, and 3500.
* **Annotations:**
* Dashed gray boxes: Enclose regions of activity.
* Solid red boxes: Enclose periods of inactivity ("stay").
* Text annotations: "stair down", "stay", "stair up", "walk" indicate the activity within the corresponding region.
### Detailed Analysis
**Top Plot (x-axis accelerometer data):**
* Color: Blue
* Trend: The blue line shows oscillatory behavior during "stair down", "stair up", and "walk" periods, with relatively flat lines during "stay" periods.
* Stair Down (0-500): Oscillating between -1 and 0.
* Stay (1000-1500): Flat line at approximately -0.1.
* Stair Up (2000-2500): Oscillating between -1 and 0.
* Walk (3000-3500): Oscillating between -1 and 0.
**Middle Plot (y-axis accelerometer data):**
* Color: Orange
* Trend: The orange line shows oscillatory behavior during "stair down", "stair up", and "walk" periods, with relatively flat lines during "stay" periods.
* Stair Down (0-500): Oscillating between 0 and 1.5.
* Stay (1000-1500): Flat line at approximately 0.4.
* Stair Up (2000-2500): Oscillating between 0 and 1.
* Walk (3000-3500): Oscillating between 0 and 1.
**Bottom Plot (z-axis accelerometer data):**
* Color: Green
* Trend: The green line shows oscillatory behavior during "stair down", "stair up", and "walk" periods, with relatively flat lines during "stay" periods.
* Stair Down (0-500): Oscillating between -4 and -1.
* Stay (1000-1500): Flat line at approximately -0.5.
* Stair Up (2000-2500): Oscillating between -2 and 0.
* Walk (3000-3500): Oscillating between -1 and 0.
### Key Observations
* The "stay" periods are clearly distinguishable by the flat lines in all three plots.
* The "stair down" activity shows the most significant variation in the z-axis (green line).
* The x and y axes (blue and orange lines) show similar oscillatory patterns during the active periods.
### Interpretation
The data represents accelerometer readings during different physical activities. The x, y, and z axes capture movement in three dimensions. The "stay" periods indicate when the subject was stationary, resulting in minimal accelerometer variation. The oscillatory patterns during "stair down", "stair up", and "walk" reflect the repetitive movements associated with these activities. The z-axis data seems particularly sensitive to stair descent, possibly due to the vertical component of the motion. The consistent patterns across the x and y axes suggest coordinated movements in the horizontal plane during the active periods.