TECHNICAL ASSET FINGERPRINT
e6ad128f13de347cdbecb453
Click to view fullscreen
Press ESC or click to close
FOUND IN PAPERS
EXPERT: gemini-2.5-flash-lite-free VERSION 1
RUNTIME: google-free/gemini-2.5-flash-lite
INTEL_VERIFIED
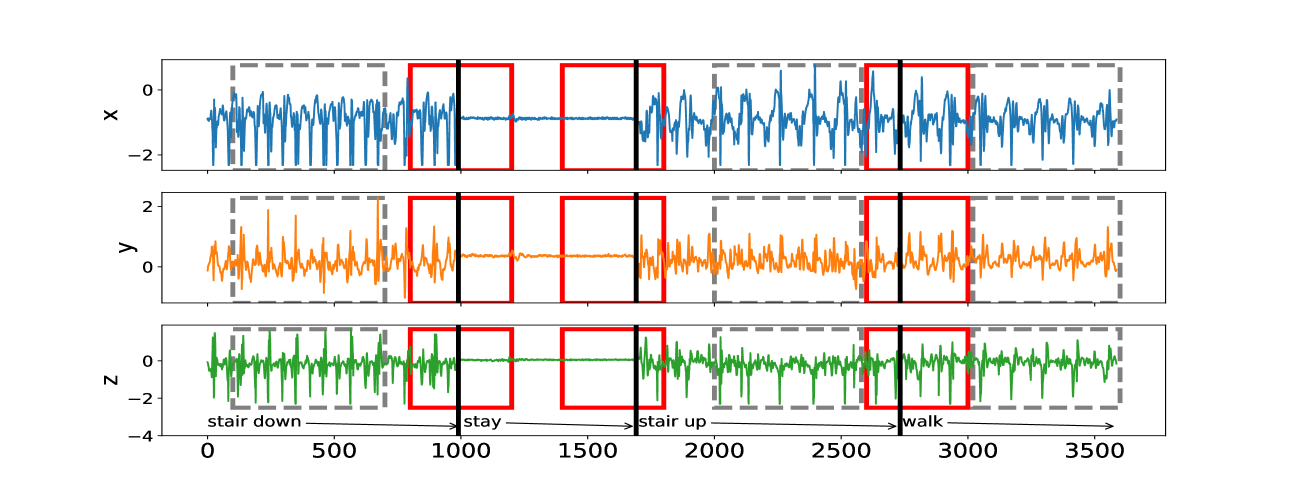
## Line Chart: Activity Recognition Data
### Overview
This image displays three line charts, stacked vertically, representing data from sensors along the x, y, and z axes over time. The charts are annotated with dashed grey boxes and solid red boxes, indicating different segments of activity. Additionally, text labels below the charts identify specific activities such as "stair down," "stay," "stair up," and "walk." The x-axis represents time, with markers at 0, 500, 1000, 1500, 2000, 2500, 3000, and 3500. The y-axis for the top chart (x-axis data) ranges from approximately -2 to 0. The y-axis for the middle chart (y-axis data) ranges from approximately 0 to 2. The y-axis for the bottom chart (z-axis data) ranges from approximately -4 to 2.
### Components/Axes
* **X-axis (Time):**
* **Labels:** 0, 500, 1000, 1500, 2000, 2500, 3000, 3500. The axis extends from 0 to approximately 3600.
* **Title:** Implicitly "Time" based on the numerical progression.
* **Y-axes (Sensor Readings):**
* **Top Chart (x-axis data):**
* **Labels:** 0, -2. The axis extends from approximately -2.5 to 0.5.
* **Title:** "x"
* **Middle Chart (y-axis data):**
* **Labels:** 2, 0. The axis extends from approximately -0.5 to 2.5.
* **Title:** "y"
* **Bottom Chart (z-axis data):**
* **Labels:** 2, 0, -2, -4. The axis extends from approximately -4.5 to 2.5.
* **Title:** "z"
* **Data Series:**
* **Blue Line:** Represents data from the x-axis sensor.
* **Orange Line:** Represents data from the y-axis sensor.
* **Green Line:** Represents data from the z-axis sensor.
* **Annotations:**
* **Dashed Grey Boxes:** These boxes appear to demarcate broader periods of activity. They are present at the beginning of each chart, and then at approximately:
* x-axis: 0-500, 1500-2000, 2500-3000, 3000-3500
* y-axis: 0-500, 1500-2000, 2500-3000, 3000-3500
* z-axis: 0-500, 1500-2000, 2500-3000, 3000-3500
* **Solid Red Boxes:** These boxes highlight specific, shorter segments within the broader periods. They are present at approximately:
* x-axis: 750-1000, 1000-1250, 1250-1500, 1750-2000, 2750-3000, 3250-3500
* y-axis: 750-1000, 1000-1250, 1250-1500, 1750-2000, 2750-3000, 3250-3500
* z-axis: 750-1000, 1000-1250, 1250-1500, 1750-2000, 2750-3000, 3250-3500
* **Solid Black Vertical Lines:** These lines appear to mark the boundaries between different activities. They are located at approximately 1000, 1500, 2000, 2500, 3000, and 3500.
* **Activity Labels (below the z-axis chart):**
* "stair down": Centered around the range 0-500.
* "stay": Centered around the range 750-1500.
* "stair up": Centered around the range 1750-2000.
* "walk": Centered around the range 2500-3500.
### Detailed Analysis
**Data Series Trends and Approximate Values:**
* **Blue Line (x-axis data):**
* **Trend:** The blue line exhibits a generally periodic pattern with significant amplitude variations. It shows a high frequency of sharp peaks and troughs, suggesting rapid movements.
* **Segment 1 (approx. 0-750):** Characterized by frequent, high-amplitude oscillations, peaking around 0 and dipping to approximately -2. This segment is labeled "stair down."
* **Segment 2 (approx. 750-1000):** Shows a transition with slightly reduced amplitude oscillations.
* **Segment 3 (approx. 1000-1500):** This segment, labeled "stay," shows a near-flat line with very low amplitude oscillations, centered around 0. The values are approximately between -0.2 and 0.2.
* **Segment 4 (approx. 1750-2000):** Labeled "stair up," this segment shows a return to higher amplitude oscillations, similar to the "stair down" phase but potentially with slightly different characteristics. Peaks are around 0, troughs around -2.
* **Segment 5 (approx. 2000-2500):** Shows a transition period.
* **Segment 6 (approx. 2500-3500):** Labeled "walk," this segment displays a consistent, rhythmic pattern of oscillations with moderate amplitude, peaking around 0 and dipping to approximately -1.5.
* **Orange Line (y-axis data):**
* **Trend:** The orange line shows more irregular, but still somewhat periodic, fluctuations. The amplitude is generally lower than the x-axis data during movement phases.
* **Segment 1 (approx. 0-750):** Exhibits moderate amplitude oscillations, ranging from approximately 0 to 2. This segment is associated with "stair down."
* **Segment 2 (approx. 750-1000):** Shows a decrease in amplitude.
* **Segment 3 (approx. 1000-1500):** Labeled "stay," this segment is characterized by very low amplitude oscillations, close to 0, with values ranging from approximately -0.2 to 0.2.
* **Segment 4 (approx. 1750-2000):** Labeled "stair up," this segment shows increased oscillations, similar to the initial phase, ranging from approximately 0 to 2.
* **Segment 5 (approx. 2000-2500):** Transition period.
* **Segment 6 (approx. 2500-3500):** Labeled "walk," this segment shows consistent, rhythmic oscillations with moderate amplitude, ranging from approximately 0 to 1.5.
* **Green Line (z-axis data):**
* **Trend:** The green line displays a highly periodic pattern with sharp, distinct peaks and troughs, particularly during movement phases.
* **Segment 1 (approx. 0-750):** Characterized by very sharp, high-amplitude peaks, reaching up to approximately 2, and deep troughs, down to approximately -4. This segment is labeled "stair down."
* **Segment 2 (approx. 750-1000):** Shows a decrease in the sharpness and amplitude of peaks.
* **Segment 3 (approx. 1000-1500):** Labeled "stay," this segment shows very low amplitude oscillations, close to 0, with values ranging from approximately -0.5 to 0.5.
* **Segment 4 (approx. 1750-2000):** Labeled "stair up," this segment shows a return to sharp, high-amplitude peaks, similar to the "stair down" phase, reaching up to approximately 2 and down to approximately -4.
* **Segment 5 (approx. 2000-2500):** Transition period.
* **Segment 6 (approx. 2500-3500):** Labeled "walk," this segment displays a consistent, rhythmic pattern of sharp peaks and troughs, with moderate amplitude, peaking around 1.5 and dipping to approximately -2.
**Annotation Placement and Correlation:**
* The dashed grey boxes generally encompass the periods labeled with activities. For instance, the first grey box (0-500) aligns with "stair down." The grey boxes from 1500-2000 align with "stair up," and from 2500-3500 align with "walk."
* The solid red boxes appear to highlight specific sub-segments within these activities, possibly representing individual steps or distinct phases of movement. For example, within the "stay" period (1000-1500), there are multiple red boxes, each containing a near-flat line.
* The solid black vertical lines clearly delineate the transitions between the labeled activities. For example, the line at 1000 marks the end of "stair down" and the beginning of "stay." The line at 1500 marks the end of "stay" and the beginning of the transition to "stair up." The line at 2000 marks the end of "stair up." The line at 2500 marks the beginning of "walk." The line at 3000 and 3500 mark further points within the "walk" period.
### Key Observations
* **Activity Signatures:** Each labeled activity ("stair down," "stay," "stair up," "walk") has a distinct signature across the x, y, and z sensor data.
* **"Stay"** is characterized by very low amplitude oscillations across all three axes, indicating minimal movement.
* **"Stair down" and "Stair up"** show high-amplitude, sharp oscillations, particularly in the z-axis, suggesting significant vertical movement. The x-axis also shows high-amplitude, rapid oscillations.
* **"Walk"** exhibits a more consistent, rhythmic pattern with moderate amplitudes across all axes, distinct from the more erratic or sharp movements of stair climbing.
* **Axis Dominance:** The z-axis data appears to be the most sensitive to vertical movements like stair climbing, showing the sharpest and highest amplitude peaks. The x-axis data is also highly dynamic during movement, reflecting forward/backward or side-to-side motion. The y-axis data shows more subtle variations.
* **Transitions:** The transitions between activities are visually represented by changes in the amplitude and frequency of the sensor readings. The solid black lines mark these distinct shifts.
* **Segmentation:** The use of dashed grey and solid red boxes suggests a hierarchical segmentation of the data, with grey boxes defining broader activity periods and red boxes highlighting finer-grained events within those periods.
### Interpretation
This chart demonstrates the effectiveness of using multi-axis sensor data (likely from an accelerometer or similar inertial measurement unit) to distinguish between different human activities. The distinct patterns observed in the x, y, and z sensor readings for "stair down," "stay," "stair up," and "walk" suggest that these activities have unique kinematic profiles.
The "stay" activity, with its near-zero amplitude across all axes, clearly represents a period of inactivity. The sharp, high-amplitude spikes in the z-axis data during "stair down" and "stair up" are indicative of the impact and vertical displacement associated with climbing stairs. The "walk" activity shows a more regular, cyclical pattern, reflecting the repetitive nature of gait.
The annotations (dashed grey boxes, solid red boxes, and black vertical lines) are crucial for understanding the temporal segmentation of these activities. They likely represent the output of an activity recognition algorithm that has identified and labeled these distinct behavioral states. The red boxes, in particular, might represent individual steps or micro-movements within a larger activity.
In essence, the data suggests that by analyzing the temporal dynamics of sensor readings along multiple axes, it is possible to reliably classify human activities. This type of data visualization is fundamental in the field of wearable technology, human-computer interaction, and health monitoring, where understanding user activity is paramount. The clear differentiation between activities implies that a machine learning model trained on such data could achieve high accuracy in activity recognition.
DECODING INTELLIGENCE...