TECHNICAL ASSET FINGERPRINT
e6ad128f13de347cdbecb453
Click to view fullscreen
Press ESC or click to close
FOUND IN PAPERS
EXPERT: healer-alpha-free VERSION 1
RUNTIME: free/openrouter/healer-alpha
INTEL_VERIFIED
## Time-Series Chart: Multi-Axis Movement Data with Activity Segmentation
### Overview
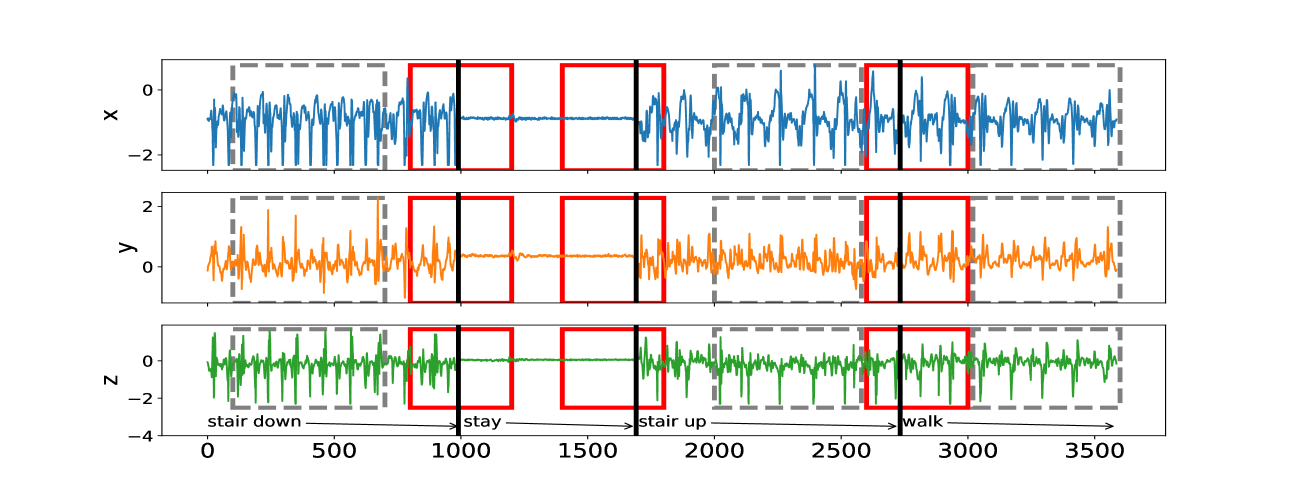
The image displays a three-panel time-series chart showing synchronized data from three axes (labeled x, y, z) over a common time axis. The data appears to represent movement or acceleration signals, segmented into four distinct activity phases: "stair down," "stay," "stair up," and "walk." Specific time intervals within these phases are highlighted with colored rectangular boxes.
### Components/Axes
* **Chart Type:** Three vertically stacked line charts (subplots) sharing a common x-axis.
* **X-Axis (Common):**
* **Label:** Not explicitly labeled with a title, but represents time or sample index.
* **Scale:** Linear, ranging from 0 to 3500.
* **Major Ticks:** 0, 500, 1000, 1500, 2000, 2500, 3000, 3500.
* **Y-Axes (Individual):**
* **Top Subplot:** Labeled "x". Scale ranges approximately from -2 to +1.
* **Middle Subplot:** Labeled "y". Scale ranges approximately from -1 to +2.
* **Bottom Subplot:** Labeled "z". Scale ranges approximately from -4 to +1.
* **Data Series (Lines):**
* **Top (x-axis):** Blue line.
* **Middle (y-axis):** Orange line.
* **Bottom (z-axis):** Green line.
* **Activity Phase Labels & Annotations (Bottom of Chart):**
* Text labels with arrows indicating temporal duration, placed below the bottom subplot's x-axis.
* **"stair down"**: Arrow spans from ~0 to ~1000.
* **"stay"**: Arrow spans from ~1000 to ~1700.
* **"stair up"**: Arrow spans from ~1700 to ~2700.
* **"walk"**: Arrow spans from ~2700 to ~3500.
* **Highlight Boxes (Overlaid on all three subplots):**
* **Red Solid-Line Rectangles:** Appear at approximately:
1. x=800 to x=1000 (within "stair down").
2. x=1400 to x=1700 (within "stay").
3. x=2600 to x=2800 (within "stair up" / transition to "walk").
* **Gray Dashed-Line Rectangles:** Appear at approximately:
1. x=100 to x=700 (within "stair down").
2. x=2000 to x=2600 (within "stair up").
3. x=2800 to x=3500 (within "walk").
### Detailed Analysis
**Trend Verification per Activity Phase:**
1. **"stair down" (0 - ~1000):**
* **x (Blue):** High-amplitude, high-frequency oscillations. Trend is consistently variable.
* **y (Orange):** Moderate-amplitude, high-frequency oscillations. Trend is consistently variable.
* **z (Green):** High-amplitude, high-frequency oscillations with a slight negative bias. Trend is consistently variable.
* **Segmentation:** Contains a gray dashed box (early phase) and a red solid box (late phase).
2. **"stay" (~1000 - ~1700):**
* **x (Blue):** Signal becomes very flat, near zero. Trend is stable with minimal noise.
* **y (Orange):** Signal becomes very flat, near zero. Trend is stable with minimal noise.
* **z (Green):** Signal becomes very flat, near zero. Trend is stable with minimal noise.
* **Segmentation:** Contains a red solid box in the latter half.
3. **"stair up" (~1700 - ~2700):**
* **x (Blue):** Resumes high-amplitude, high-frequency oscillations, similar to "stair down".
* **y (Orange):** Resumes moderate-amplitude, high-frequency oscillations.
* **z (Green):** Resumes high-amplitude oscillations, but appears slightly less negative than during "stair down".
* **Segmentation:** Contains a gray dashed box (middle phase) and a red solid box at the very end, overlapping the transition to "walk".
4. **"walk" (~2700 - 3500):**
* **x (Blue):** Oscillations continue but appear slightly more regular/rhythmic compared to stair activities.
* **y (Orange):** Oscillations continue with a consistent pattern.
* **z (Green):** Oscillations continue, centered near zero.
* **Segmentation:** Contains a gray dashed box covering the entire phase.
### Key Observations
* **Clear State Differentiation:** The "stay" period is visually distinct from all other activities across all three axes, showing near-zero signal.
* **Activity Similarity:** The signal patterns for "stair down," "stair up," and "walk" are broadly similar (high variability), suggesting they are all dynamic locomotion activities. Subtle differences in amplitude or offset (especially in the z-axis) may differentiate them.
* **Synchronized Highlighting:** The red and gray boxes are applied identically across all three subplots (x, y, z) at the same time intervals, indicating they mark specific events or segments of interest in the overall movement, not specific to one axis.
* **Transition Marker:** The final red box (~2600-2800) straddles the labeled boundary between "stair up" and "walk," potentially highlighting a transition event.
### Interpretation
This chart visualizes tri-axial accelerometer (or similar inertial sensor) data from a device, likely worn by a person, during a sequence of activities. The data demonstrates clear, learnable patterns for activity recognition:
1. **Stationary vs. Dynamic:** The most fundamental classification is between stationary ("stay") and dynamic (all other) states.
2. **Activity Segmentation:** The labeled phases and highlighted boxes suggest this data is prepared for a machine learning task, where the goal is to automatically segment and classify time-series data into predefined activity classes. The red and gray boxes likely represent specific training examples, validation windows, or events of interest (e.g., start/stop of a movement) within the broader activity classes.
3. **Sensor Orientation:** The consistent negative bias in the z-axis during "stair down" versus its centering during "walk" could indicate the sensor's orientation relative to gravity changes with the activity (e.g., leaning forward while descending stairs).
4. **Investigative Reading:** The precise alignment of the red boxes with activity boundaries (especially the one at ~1000 marking the end of "stair down" and start of "stay") implies they may be manually annotated "ground truth" labels used to train or evaluate an algorithm. The gray boxes might represent automatically detected segments or regions of consistent signal characteristics.
**In summary, this is a technical visualization of labeled sensor data, primed for developing or validating algorithms that automatically detect and classify human physical activities based on movement signatures.**
DECODING INTELLIGENCE...