\n
## Diagram: Sample Verification Chains
### Overview
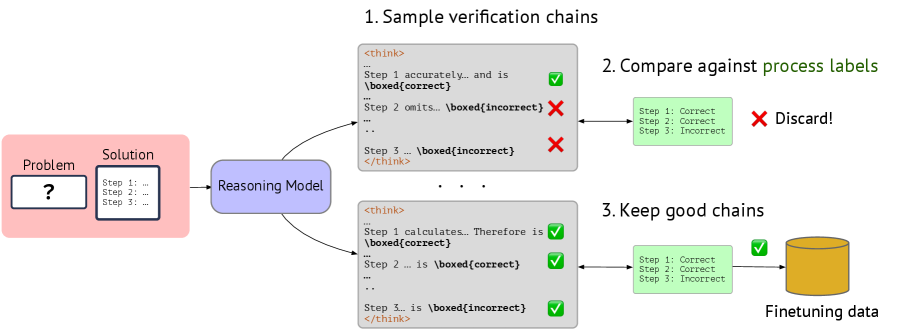
This diagram illustrates a process for verifying reasoning chains generated by a "Reasoning Model" to create a dataset for finetuning. It depicts a workflow where potential solutions are evaluated against process labels, and only valid chains are retained for use as finetuning data.
### Components/Axes
The diagram consists of three main sections, arranged horizontally:
1. **Problem & Solution:** A red rounded rectangle labeled "Problem" with a question mark inside, connected by an arrow to a pink rounded rectangle labeled "Solution" with "Step 1:", "Step 2:", and "Step 3:" listed vertically.
2. **Verification & Comparison:** Two rectangular boxes, one labeled "1. Sample verification chains" and the other "2. Compare against process labels".
3. **Data Retention:** A rectangular box labeled "3. Keep good chains" connected to a cylinder labeled "Finetuning data".
There are also visual indicators (checkmarks and crosses) used to represent the correctness of each step in the reasoning chain.
### Detailed Analysis or Content Details
**Section 1: Problem & Solution**
- The "Problem" is represented by a red rectangle with a question mark.
- The "Solution" is represented by a pink rectangle, outlining a three-step process.
**Section 2: Verification & Comparison**
- **Box 1 ("Sample verification chains"):** Contains two examples of reasoning chains within green boxes. The text within these boxes is formatted as code:
- **Chain 1 (Discarded):**
```
```
This chain is marked with red "X" symbols next to steps 2 and 3.
- **Chain 2 (Kept):**
```
```
This chain is marked with green checkmarks next to steps 1 and 2, and a red "X" next to step 3.
- **Box 2 ("Compare against process labels"):** Shows a list of "Step" evaluations:
- Step 1: Correct
- Step 2: Incorrect
- Step 3: Incorrect
This box has a large red "X" symbol indicating the entire chain is discarded.
**Section 3: Data Retention**
- **Box 3 ("Keep good chains"):** Shows a list of "Step" evaluations:
- Step 1: Correct
- Step 2: Correct
- Step 3: Incorrect
This box has a green checkmark symbol.
- The output of this box is connected to a yellow cylinder labeled "Finetuning data".
### Key Observations
- The diagram highlights a filtering process. Reasoning chains are evaluated step-by-step.
- A chain is discarded if *any* step is incorrect.
- The `<think>` tags suggest the content within represents the internal reasoning process of the model.
- The `boxed[correct]` and `boxed[incorrect]` notations indicate the outcome of evaluating each step.
- The diagram visually emphasizes the importance of all steps being correct for a chain to be considered valid.
### Interpretation
The diagram illustrates a quality control mechanism for generating training data for a reasoning model. The model generates potential solutions (chains of reasoning steps), and these are then rigorously evaluated against predefined "process labels" (ground truth). The diagram demonstrates a strict filtering criterion: a single incorrect step invalidates the entire chain. Only chains that consistently demonstrate correct reasoning are retained and used to refine the model through finetuning. This process aims to improve the model's accuracy and reliability by ensuring it learns from high-quality, verified examples. The use of visual cues (checkmarks, crosses, colors) effectively communicates the outcome of each evaluation step and the overall flow of the process. The diagram suggests a focus on identifying and eliminating flawed reasoning patterns to enhance the model's performance.