## Bar Chart: Prediction Flip Rate for Llama Models
### Overview
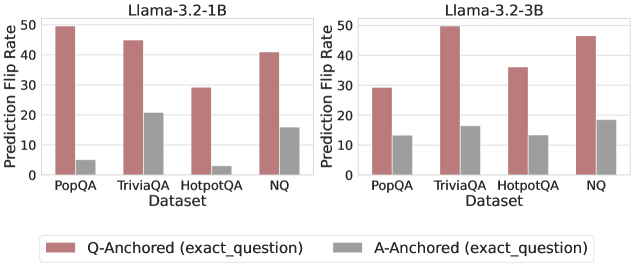
This image presents a comparative bar chart illustrating the Prediction Flip Rate for two Llama models (Llama-3.2-1B and Llama-3.2-3B) across four different datasets: PopQA, TriviaQA, HotpotQA, and NQ. The flip rate is measured for both Q-Anchored (exact question) and A-Anchored (exact question) scenarios. The chart consists of two sub-charts, one for each model, positioned side-by-side.
### Components/Axes
* **X-axis:** Dataset (PopQA, TriviaQA, HotpotQA, NQ)
* **Y-axis:** Prediction Flip Rate (ranging from 0 to 50)
* **Models:** Llama-3.2-1B (left chart), Llama-3.2-3B (right chart)
* **Legend:**
* Q-Anchored (exact\_question) - represented by a reddish-brown color.
* A-Anchored (exact\_question) - represented by a gray color.
### Detailed Analysis
**Llama-3.2-1B (Left Chart)**
* **PopQA:** Q-Anchored: approximately 52, A-Anchored: approximately 8.
* **TriviaQA:** Q-Anchored: approximately 45, A-Anchored: approximately 22.
* **HotpotQA:** Q-Anchored: approximately 32, A-Anchored: approximately 12.
* **NQ:** Q-Anchored: approximately 48, A-Anchored: approximately 16.
The Q-Anchored bars consistently show higher flip rates than the A-Anchored bars across all datasets. The highest flip rate for this model is observed on the PopQA dataset for Q-Anchored questions.
**Llama-3.2-3B (Right Chart)**
* **PopQA:** Q-Anchored: approximately 32, A-Anchored: approximately 10.
* **TriviaQA:** Q-Anchored: approximately 52, A-Anchored: approximately 18.
* **HotpotQA:** Q-Anchored: approximately 40, A-Anchored: approximately 12.
* **NQ:** Q-Anchored: approximately 48, A-Anchored: approximately 16.
Similar to the 1B model, the Q-Anchored bars exhibit higher flip rates than the A-Anchored bars. The highest flip rate for this model is observed on the TriviaQA dataset for Q-Anchored questions.
### Key Observations
* The Q-Anchored flip rate is consistently higher than the A-Anchored flip rate for both models across all datasets.
* The Llama-3.2-3B model generally shows lower flip rates on PopQA and HotpotQA compared to the Llama-3.2-1B model, but higher on TriviaQA.
* The PopQA dataset consistently shows a relatively high flip rate for the Q-Anchored scenario, especially for the Llama-3.2-1B model.
### Interpretation
The data suggests that the method of anchoring (question vs. answer) significantly impacts the prediction flip rate. Anchoring based on the question (Q-Anchored) leads to a substantially higher rate of prediction flips compared to anchoring based on the answer (A-Anchored). This could indicate that the models are more sensitive to variations in the question phrasing than variations in the answer.
The differences in flip rates between the two models (1B and 3B) across different datasets suggest that model size and dataset characteristics interact. The larger model (3B) appears to be more robust on some datasets (PopQA, HotpotQA) but less so on others (TriviaQA). This could be due to differences in the training data or the complexity of the questions within each dataset.
The high flip rate on the PopQA dataset, particularly for the 1B model, might indicate that this dataset presents a unique challenge for the models, potentially due to the nature of the questions or the distribution of answers. Further investigation into the characteristics of the PopQA dataset is warranted. The data suggests that the models are not consistently stable in their predictions, and small changes in input can lead to significant changes in output.