## Chart: Mutual Information Surprise
### Overview
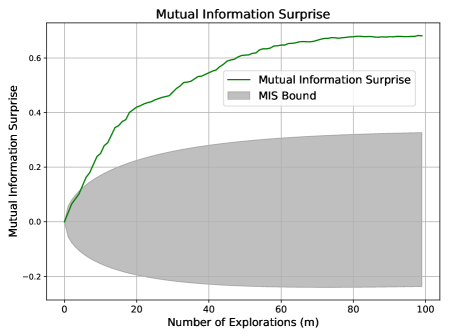
The image is a line chart that plots "Mutual Information Surprise" against "Number of Explorations (m)". It shows the trend of Mutual Information Surprise and a shaded region representing the MIS Bound.
### Components/Axes
* **Title:** Mutual Information Surprise
* **X-axis:** Number of Explorations (m), with ticks at 0, 20, 40, 60, 80, and 100.
* **Y-axis:** Mutual Information Surprise, with ticks at -0.2, 0.0, 0.2, 0.4, and 0.6.
* **Legend:** Located in the top-right of the chart.
* Mutual Information Surprise (Green Line)
* MIS Bound (Grey Shaded Area)
### Detailed Analysis
* **Mutual Information Surprise (Green Line):** The line starts at approximately 0 at 0 explorations. It increases rapidly until around 40 explorations, reaching a value of approximately 0.6. After 40 explorations, the line continues to increase, but at a much slower rate, approaching a value of approximately 0.68 at 100 explorations.
* (0, 0)
* (20, 0.4)
* (40, 0.6)
* (100, 0.68)
* **MIS Bound (Grey Shaded Area):** The shaded area starts at approximately 0 at 0 explorations. It expands both positively and negatively, reaching its maximum width around 60 explorations. The upper bound of the shaded area reaches approximately 0.32, and the lower bound reaches approximately -0.22.
* Upper Bound:
* (0, 0)
* (60, 0.32)
* (100, 0.32)
* Lower Bound:
* (0, 0)
* (60, -0.22)
* (100, -0.22)
### Key Observations
* The Mutual Information Surprise increases rapidly initially and then plateaus.
* The MIS Bound represents a range of possible values, expanding and then stabilizing.
* The Mutual Information Surprise line remains above the lower bound of the MIS Bound throughout the entire range of explorations.
### Interpretation
The chart suggests that as the number of explorations increases, the mutual information surprise initially grows rapidly, indicating a quick learning phase. As explorations continue, the surprise diminishes, suggesting that the system is converging towards a stable understanding. The MIS Bound provides a confidence interval or range of expected values, and the fact that the Mutual Information Surprise line stays within or above this bound indicates that the observed surprise is within the expected range, or even exceeds the lower bound of expectations. This could imply efficient learning or a well-designed exploration strategy.