\n
## Line Chart: Mutual Information Surprise
### Overview
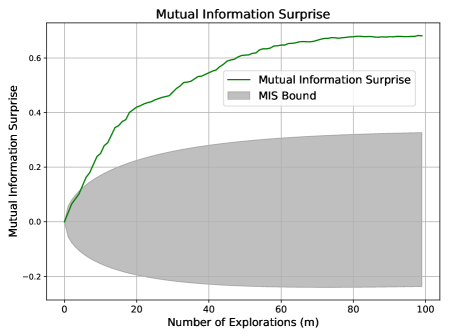
The image presents a line chart illustrating the relationship between the number of explorations (m) and the mutual information surprise. A shaded region represents the MIS bound. The chart aims to visualize how the mutual information surprise changes as the number of explorations increases, along with a confidence or uncertainty bound.
### Components/Axes
* **Title:** "Mutual Information Surprise" (centered at the top)
* **X-axis:** "Number of Explorations (m)" - ranging from approximately 0 to 100.
* **Y-axis:** "Mutual Information Surprise" - ranging from approximately -0.02 to 0.65.
* **Legend:** Located in the top-right corner.
* "Mutual Information Surprise" - represented by a green line.
* "MIS Bound" - represented by a gray shaded area.
* **Grid:** A light gray grid is present throughout the chart area, aiding in value estimation.
### Detailed Analysis
The chart displays a single green line representing "Mutual Information Surprise" and a gray shaded area representing the "MIS Bound".
* **Mutual Information Surprise (Green Line):**
* The line starts at approximately 0.00 at x=0.
* It increases rapidly between x=0 and x=20, reaching approximately 0.40.
* The rate of increase slows down between x=20 and x=60, reaching approximately 0.55.
* The line plateaus between x=60 and x=100, reaching a maximum value of approximately 0.63.
* **MIS Bound (Gray Shaded Area):**
* The shaded area starts at approximately -0.02 at x=0.
* It widens as the number of explorations increases, reaching a maximum width between x=40 and x=80.
* The upper bound of the shaded area remains relatively constant at approximately 0.30 after x=40.
* The lower bound of the shaded area remains relatively constant at approximately -0.02 after x=20.
### Key Observations
* The Mutual Information Surprise increases with the number of explorations, but the rate of increase diminishes over time.
* The MIS Bound provides a range of possible values for the Mutual Information Surprise, indicating uncertainty.
* The MIS Bound is most wide at the beginning of the exploration process, indicating higher uncertainty.
* The Mutual Information Surprise appears to converge towards a stable value as the number of explorations increases.
### Interpretation
The chart suggests that increasing the number of explorations initially leads to a significant increase in mutual information surprise. However, as the number of explorations grows, the marginal benefit of additional explorations decreases. The MIS bound indicates the range of plausible values for the mutual information surprise, reflecting the inherent uncertainty in the process. The convergence of the Mutual Information Surprise line suggests that there is a limit to the amount of information that can be gained through further exploration. This could be due to the inherent limitations of the system being explored or the diminishing returns of continued exploration. The initial wide MIS bound suggests a high degree of uncertainty at the start, which decreases as more data is gathered through exploration. This is a common pattern in information-gathering processes, where initial explorations provide the most significant gains in understanding.