## Line Graph: Mutual Information Surprise
### Overview
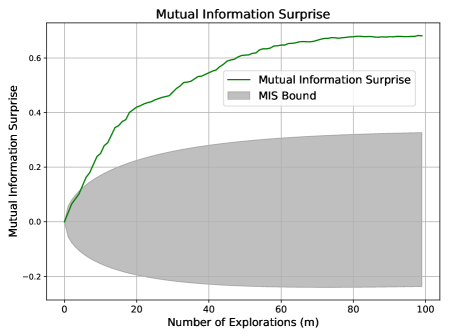
The image is a line graph titled "Mutual Information Surprise," depicting the relationship between the number of explorations (m) and mutual information surprise. A green line represents the "Mutual Information Surprise" metric, while a gray shaded region labeled "MIS Bound" spans the lower portion of the graph. The x-axis ranges from 0 to 100 (number of explorations), and the y-axis ranges from -0.2 to 0.6 (mutual information surprise).
### Components/Axes
- **X-axis**: "Number of Explorations (m)" with ticks at 0, 20, 40, 60, 80, and 100.
- **Y-axis**: "Mutual Information Surprise" with ticks at -0.2, 0.0, 0.2, 0.4, and 0.6.
- **Legend**: Located in the top-right corner, with:
- **Green line**: "Mutual Information Surprise"
- **Gray shaded area**: "MIS Bound"
- **Line**: A green curve starting at (0, 0) and increasing to approximately (100, 0.65).
- **Shaded Region**: A gray area spanning the entire x-axis (0–100) and y-axis (-0.2 to 0.2).
### Detailed Analysis
- **Mutual Information Surprise (Green Line)**:
- Starts at (0, 0) and rises sharply to ~0.4 by x=20.
- Continues to increase at a slower rate, reaching ~0.65 at x=100.
- The curve exhibits a concave upward trend, with diminishing returns as x increases.
- **MIS Bound (Gray Shaded Area)**:
- A constant horizontal band from y=-0.2 to y=0.2 across all x-values (0–100).
- The green line remains below the upper bound (y=0.2) until x≈40, after which it surpasses the bound.
### Key Observations
1. **Increasing Trend**: Mutual information surprise grows monotonically with the number of explorations, suggesting a positive correlation between exploration and surprise.
2. **Bound Violation**: The green line exceeds the MIS Bound (y=0.2) after ~40 explorations, indicating that the observed surprise surpasses the theoretical or expected limit defined by the bound.
3. **Diminishing Returns**: The slope of the green line decreases after x=40, implying that additional explorations yield smaller increments in surprise.
### Interpretation
The graph demonstrates that mutual information surprise increases with exploration, but the rate of growth slows over time. The MIS Bound likely represents a theoretical or empirical threshold for surprise, which the system initially adheres to but eventually surpasses. This could imply that the exploration process becomes more effective at generating novel or unexpected outcomes as it progresses, or that the bound itself is a conservative estimate. The violation of the bound after 40 explorations suggests a critical point where the system's behavior diverges from expected patterns, potentially highlighting a phase transition or emergent property in the data-generating process.