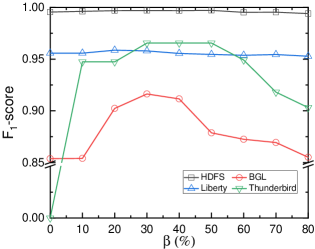
# Technical Data Extraction: F1-score vs. $\beta$ (%) Performance Chart
## 1. Component Isolation
* **Header:** None present.
* **Main Chart Area:** A line graph plotted on a light gray background with a white border. It features a broken Y-axis to accommodate a wide range of values (0.00 to 1.00).
* **Legend:** Located in the bottom-right quadrant of the plot area.
* **Axes:**
* **Y-axis (Vertical):** Labeled "$F_1$-score". Scale ranges from 0.00 to 1.00, with a break between 0.00 and 0.85.
* **X-axis (Horizontal):** Labeled "$\beta$ (%)". Scale ranges from 0 to 80 in increments of 10.
---
## 2. Legend and Data Series Identification
The legend is positioned at approximately $[x=0.6, y=0.2]$ relative to the chart area. It identifies four distinct data series:
| Series Name | Color | Marker Shape | Trend Description |
| :--- | :--- | :--- | :--- |
| **HDFS** | Black | Square ($\square$) | Extremely stable; remains near 1.00 across all $\beta$ values. |
| **Liberty** | Blue | Upward Triangle ($\triangle$) | Very stable; maintains a consistent value near 0.95. |
| **BGL** | Red | Circle ($\circ$) | Bell-shaped curve; rises from 0 to 30%, then declines steadily. |
| **Thunderbird** | Green | Downward Triangle ($\nabla$) | Sharp initial rise, plateau between 30-50%, then significant decline. |
---
## 3. Data Extraction and Trend Verification
### Series 1: HDFS (Black Line, Square Marker)
* **Trend:** Horizontal line. The performance is unaffected by the change in $\beta$.
* **Data Points:**
* $\beta=0$ to $80$: Consistently stays at approximately **0.99 to 1.00**.
### Series 2: Liberty (Blue Line, Upward Triangle)
* **Trend:** Horizontal line with negligible fluctuations.
* **Data Points:**
* $\beta=0$ to $80$: Consistently stays at approximately **0.95 to 0.96**.
### Series 3: BGL (Red Line, Circle Marker)
* **Trend:** Starts at a baseline, peaks at $\beta=30\%$, and then degrades.
* **Data Points (Approximate):**
* $\beta=0$: 0.85
* $\beta=10$: 0.85
* $\beta=20$: 0.90
* $\beta=30$: **0.92 (Peak)**
* $\beta=40$: 0.91
* $\beta=50$: 0.88
* $\beta=60$: 0.87
* $\beta=70$: 0.87
* $\beta=80$: 0.85
### Series 4: Thunderbird (Green Line, Downward Triangle)
* **Trend:** Rapid ascent from zero, a high-performance plateau, followed by a steep descent after $\beta=50\%$.
* **Data Points (Approximate):**
* $\beta=0$: 0.00
* $\beta=10$: 0.95
* $\beta=20$: 0.95
* $\beta=30$: **0.97 (Peak Plateau Start)**
* $\beta=40$: 0.97
* $\beta=50$: 0.97 (Peak Plateau End)
* $\beta=60$: 0.95
* $\beta=70$: 0.92
* $\beta=80$: 0.90
---
## 4. Axis and Label Transcription
* **Y-axis Title:** $F_1$-score
* **Y-axis Markers:** 0.00, 0.85, 0.90, 0.95, 1.00 (Note: There is a visual break symbol "//" between 0.00 and 0.85).
* **X-axis Title:** $\beta$ (%)
* **X-axis Markers:** 0, 10, 20, 30, 40, 50, 60, 70, 80
* **Legend Text:**
* HDFS
* BGL
* Liberty
* Thunderbird
---
## 5. Summary of Findings
The chart evaluates the sensitivity of the $F_1$-score to the parameter $\beta$ across four datasets. **HDFS** and **Liberty** are highly robust to changes in $\beta$. **Thunderbird** requires $\beta > 0$ to function but performs best between 30% and 50%. **BGL** shows a clear optimal performance point at $\beta=30\%$, with performance degrading as the parameter moves toward either extreme.