# Technical Document Analysis of Line Chart
## Chart Overview
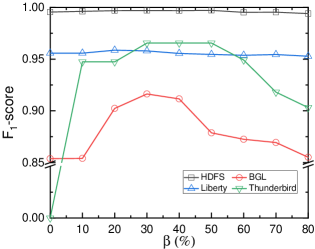
The image depicts a line chart comparing the performance of four algorithms across varying β (%) values. The y-axis represents F₁-score (0.00–1.00), and the x-axis represents β (%) (0–80). Four data series are plotted with distinct markers and colors.
---
## Legend & Spatial Grounding
- **Legend Location**: Bottom-right corner of the chart.
- **Legend Entries**:
- **HDFS**: Black squares (□)
- **BGL**: Red circles (●)
- **Liberty**: Blue triangles (▲)
- **Thunderbird**: Green triangles (▲)
---
## Axis Labels
- **X-axis**: β (%)
- Range: 0 to 80 (increments of 10)
- **Y-axis**: F₁-score
- Range: 0.00 to 1.00 (increments of 0.05)
---
## Data Series Analysis
### 1. HDFS (Black Squares)
- **Trend**: Flat line at F₁-score = 1.00 across all β values.
- **Key Points**:
- β = 0%: 1.00
- β = 10%: 1.00
- β = 20%: 1.00
- β = 30%: 1.00
- β = 40%: 1.00
- β = 50%: 1.00
- β = 60%: 1.00
- β = 70%: 1.00
- β = 80%: 1.00
### 2. BGL (Red Circles)
- **Trend**: Peaks at β = 30%, then declines.
- **Key Points**:
- β = 0%: 0.85
- β = 10%: 0.85
- β = 20%: 0.90
- β = 30%: 0.92
- β = 40%: 0.91
- β = 50%: 0.88
- β = 60%: 0.87
- β = 70%: 0.86
- β = 80%: 0.85
### 3. Liberty (Blue Triangles)
- **Trend**: Stable with minor fluctuations.
- **Key Points**:
- β = 0%: 0.95
- β = 10%: 0.95
- β = 20%: 0.96
- β = 30%: 0.95
- β = 40%: 0.95
- β = 50%: 0.95
- β = 60%: 0.95
- β = 70%: 0.95
- β = 80%: 0.95
### 4. Thunderbird (Green Triangles)
- **Trend**: Sharp rise at β = 10%, plateau until β = 50%, then decline.
- **Key Points**:
- β = 0%: 0.00
- β = 10%: 0.95
- β = 20%: 0.95
- β = 30%: 0.95
- β = 40%: 0.95
- β = 50%: 0.95
- β = 60%: 0.95
- β = 70%: 0.90
- β = 80%: 0.85
---
## Cross-Reference Verification
- **Legend Colors vs. Line Colors**:
- Confirmed: Black (HDFS), Red (BGL), Blue (Liberty), Green (Thunderbird).
- **Marker Consistency**:
- All markers (□, ●, ▲) align with legend definitions.
---
## Observations
1. **HDFS** maintains perfect performance (F₁-score = 1.00) regardless of β.
2. **BGL** shows optimal performance at β = 30% (F₁-score = 0.92), with a decline at higher β values.
3. **Liberty** demonstrates consistent performance (F₁-score ≈ 0.95) across all β values.
4. **Thunderbird** exhibits a non-linear trend: rapid improvement at low β, stability in mid-range β, and degradation at high β.
---
## Conclusion
The chart highlights algorithm performance trade-offs across β values. HDFS dominates in stability, while Thunderbird shows sensitivity to β thresholds. BGL and Liberty balance performance with moderate variability.