## Chart: Lengths of Reasoning Cycles
### Overview
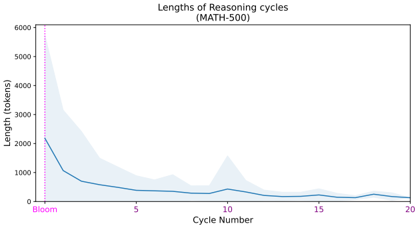
The image is a line chart showing the lengths of reasoning cycles, measured in tokens, over a series of cycles. The chart includes a vertical line indicating the "Bloom" point. The data appears to represent the performance or behavior of a system (possibly an AI model) during a reasoning process. The chart title indicates the data is from "MATH-500".
### Components/Axes
* **Title:** Lengths of Reasoning cycles (MATH-500)
* **X-axis:** Cycle Number, with markers at 0, 5, 10, 15, and 20.
* **Y-axis:** Length (tokens), with markers at 0, 1000, 2000, 3000, 4000, 5000, and 6000.
* **Data Series:** A single blue line representing the length of reasoning cycles. A shaded light blue area surrounds the line, indicating a confidence interval or standard deviation.
* **Vertical Line:** A vertical magenta line labeled "Bloom" at x=0.
### Detailed Analysis
* **Data Series Trend:** The blue line shows a decreasing trend in the length of reasoning cycles as the cycle number increases. The length drops sharply in the initial cycles and then gradually stabilizes.
* **Cycle Number:** The x-axis ranges from approximately 0 to 20.
* **Length (tokens):** The y-axis ranges from 0 to 6000 tokens.
* **Bloom Marker:** A vertical magenta line is positioned at Cycle Number 0, labeled "Bloom".
* **Data Points:**
* At Cycle 0 (Bloom), the length is approximately 2100 tokens.
* At Cycle 1, the length is approximately 1000 tokens.
* At Cycle 5, the length is approximately 400 tokens.
* At Cycle 10, the length is approximately 300 tokens.
* At Cycle 15, the length is approximately 200 tokens.
* At Cycle 20, the length is approximately 300 tokens.
* **Uncertainty:** The light blue shaded region around the blue line indicates the uncertainty or variability in the length of reasoning cycles. The uncertainty is higher in the initial cycles and decreases as the cycle number increases.
### Key Observations
* The length of reasoning cycles decreases significantly in the early cycles.
* The length stabilizes after approximately 10 cycles.
* The uncertainty in the length is higher in the early cycles.
* The "Bloom" point is associated with the highest length value.
### Interpretation
The chart suggests that the system's reasoning process becomes more efficient over time, as indicated by the decreasing length of reasoning cycles. The initial high length and uncertainty at the "Bloom" point may represent the initial exploration or learning phase of the system. The stabilization of the length after several cycles indicates that the system reaches a more consistent and efficient reasoning strategy. The MATH-500 context suggests this might be related to solving mathematical problems, where initial exploration is followed by more focused reasoning.