\n
## Line Chart: Lengths of Reasoning Cycles (MATH-500)
### Overview
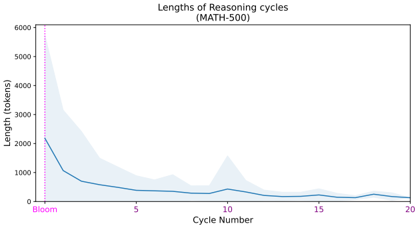
This image presents a line chart illustrating the relationship between Cycle Number and the Length of Reasoning cycles, measured in tokens. The data appears to be related to a dataset named "MATH-500". A shaded region around the line indicates a degree of uncertainty or variance.
### Components/Axes
* **Title:** "Lengths of Reasoning cycles (MATH-500)" - positioned at the top-center of the chart.
* **X-axis:** "Cycle Number" - ranging from 0 to 20, with tick marks at integer values.
* **Y-axis:** "Length (tokens)" - ranging from 0 to 6000, with tick marks at 1000-token intervals.
* **Data Series:** A single blue line representing the length of reasoning cycles.
* **Uncertainty Region:** A light blue shaded area surrounding the blue line, indicating the range of possible values.
* **Vertical Dashed Line:** A magenta vertical dashed line at Cycle Number = 0.
### Detailed Analysis
The blue line representing the length of reasoning cycles exhibits a strong downward trend initially, followed by a period of relative stability and then a slight increase.
* **Cycle 0:** The line starts at approximately 2200 tokens. The magenta dashed line at x=0 emphasizes this starting point.
* **Cycle 1-3:** The line rapidly decreases, falling to approximately 800 tokens by Cycle 3.
* **Cycle 3-7:** The decline continues, but at a slower rate, reaching a minimum of approximately 600 tokens around Cycle 6.
* **Cycle 7-10:** The line plateaus, fluctuating between 600 and 800 tokens.
* **Cycle 10-12:** A slight increase is observed, peaking at approximately 900 tokens around Cycle 11.
* **Cycle 12-20:** The line stabilizes again, remaining around 700-800 tokens.
The shaded uncertainty region is widest at the beginning (Cycle 0-3), indicating greater variability in the length of reasoning cycles at the start. The uncertainty region narrows as the cycle number increases, suggesting more consistent lengths later in the process. The uncertainty region's upper bound is approximately 5000 tokens at Cycle 0, decreasing to around 1200 tokens by Cycle 20. The lower bound of the uncertainty region remains relatively consistent around 0 tokens throughout the entire range.
### Key Observations
* The most significant decrease in reasoning cycle length occurs within the first 3 cycles.
* The length of reasoning cycles appears to converge towards a stable value of approximately 700-800 tokens after Cycle 7.
* The initial high variability in reasoning cycle length decreases over time.
* There is a minor peak in length around Cycle 11, which could be an anomaly or a temporary fluctuation.
### Interpretation
The data suggests that the reasoning process associated with the "MATH-500" dataset becomes more efficient as the cycle number increases. The initial rapid decrease in length indicates that the early cycles involve significant exploration or initial problem setup. As the process progresses, the reasoning cycles become shorter and more focused, suggesting that the core logic is being refined. The stabilization of the length after Cycle 7 implies that the reasoning process has reached a steady state. The uncertainty region indicates that while the average length of reasoning cycles stabilizes, there is still some variation in the complexity or depth of reasoning required for each cycle. The peak around Cycle 11 could represent a particularly challenging step in the reasoning process, requiring a more extensive cycle. Overall, the chart demonstrates a clear trend towards more efficient reasoning as the process iterates.