## Line Graph: Lengths of Reasoning cycles (MATH-500)
### Overview
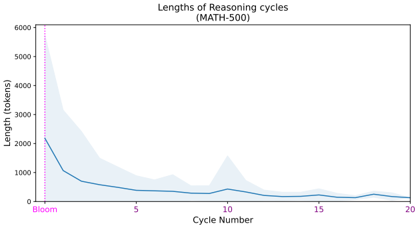
The image depicts a line graph illustrating the evolution of reasoning cycle lengths over 20 cycles, measured in tokens. A shaded area represents variability/confidence intervals, and a vertical pink dashed line marks a reference point labeled "Bloom" at cycle 0.
### Components/Axes
- **Title**: "Lengths of Reasoning cycles (MATH-500)"
- **X-axis**: "Cycle Number" (0 to 20, integer increments)
- **Y-axis**: "Length (tokens)" (0 to 6000, linear scale)
- **Legend**:
- Pink dashed line: "Bloom" (positioned at x=0)
- Blue line: Primary data series (no explicit label)
- **Shaded Area**: Represents variability/confidence intervals around the blue line
### Detailed Analysis
1. **Initial Drop (Cycle 0–5)**:
- The blue line starts at ~5,000 tokens at cycle 0 (Bloom marker).
- Sharp decline to ~1,000 tokens by cycle 5.
- Shaded area width decreases significantly during this phase.
2. **Stabilization (Cycle 5–20)**:
- Line fluctuates between ~500 and ~1,000 tokens from cycle 5 to 20.
- Shaded area narrows further, indicating reduced variability.
- Notable minor peak (~1,200 tokens) at cycle 10.
3. **Bloom Marker**:
- Vertical pink dashed line at x=0 (cycle 0).
- Coincides with the graph's highest data point (~5,000 tokens).
### Key Observations
- **Rapid Initial Decline**: Cycle lengths drop ~80% from cycle 0 to 5.
- **Stabilization**: Minimal change in average length after cycle 5.
- **Bloom Significance**: The "Bloom" marker aligns with the maximum observed length, suggesting it represents a baseline or critical threshold.
- **Confidence Intervals**: Shaded area width correlates with data volatility (widest at cycle 0, narrowest post-cycle 10).
### Interpretation
The graph demonstrates that reasoning cycle lengths decrease dramatically in the early stages (cycles 0–5), likely reflecting optimization or stabilization of a process. The "Bloom" marker at cycle 0 may indicate a starting condition or reference model (e.g., initial training phase). Post-cycle 5, the system stabilizes, with cycle lengths remaining relatively consistent (~500–1,000 tokens) and confidence intervals tightening. The minor peak at cycle 10 could signal a transient anomaly or adjustment phase. The data implies that later cycles achieve greater efficiency or consistency, with reduced variability in reasoning length.