\n
## Bar Chart: Software Error Distribution Across Benchmarks
### Overview
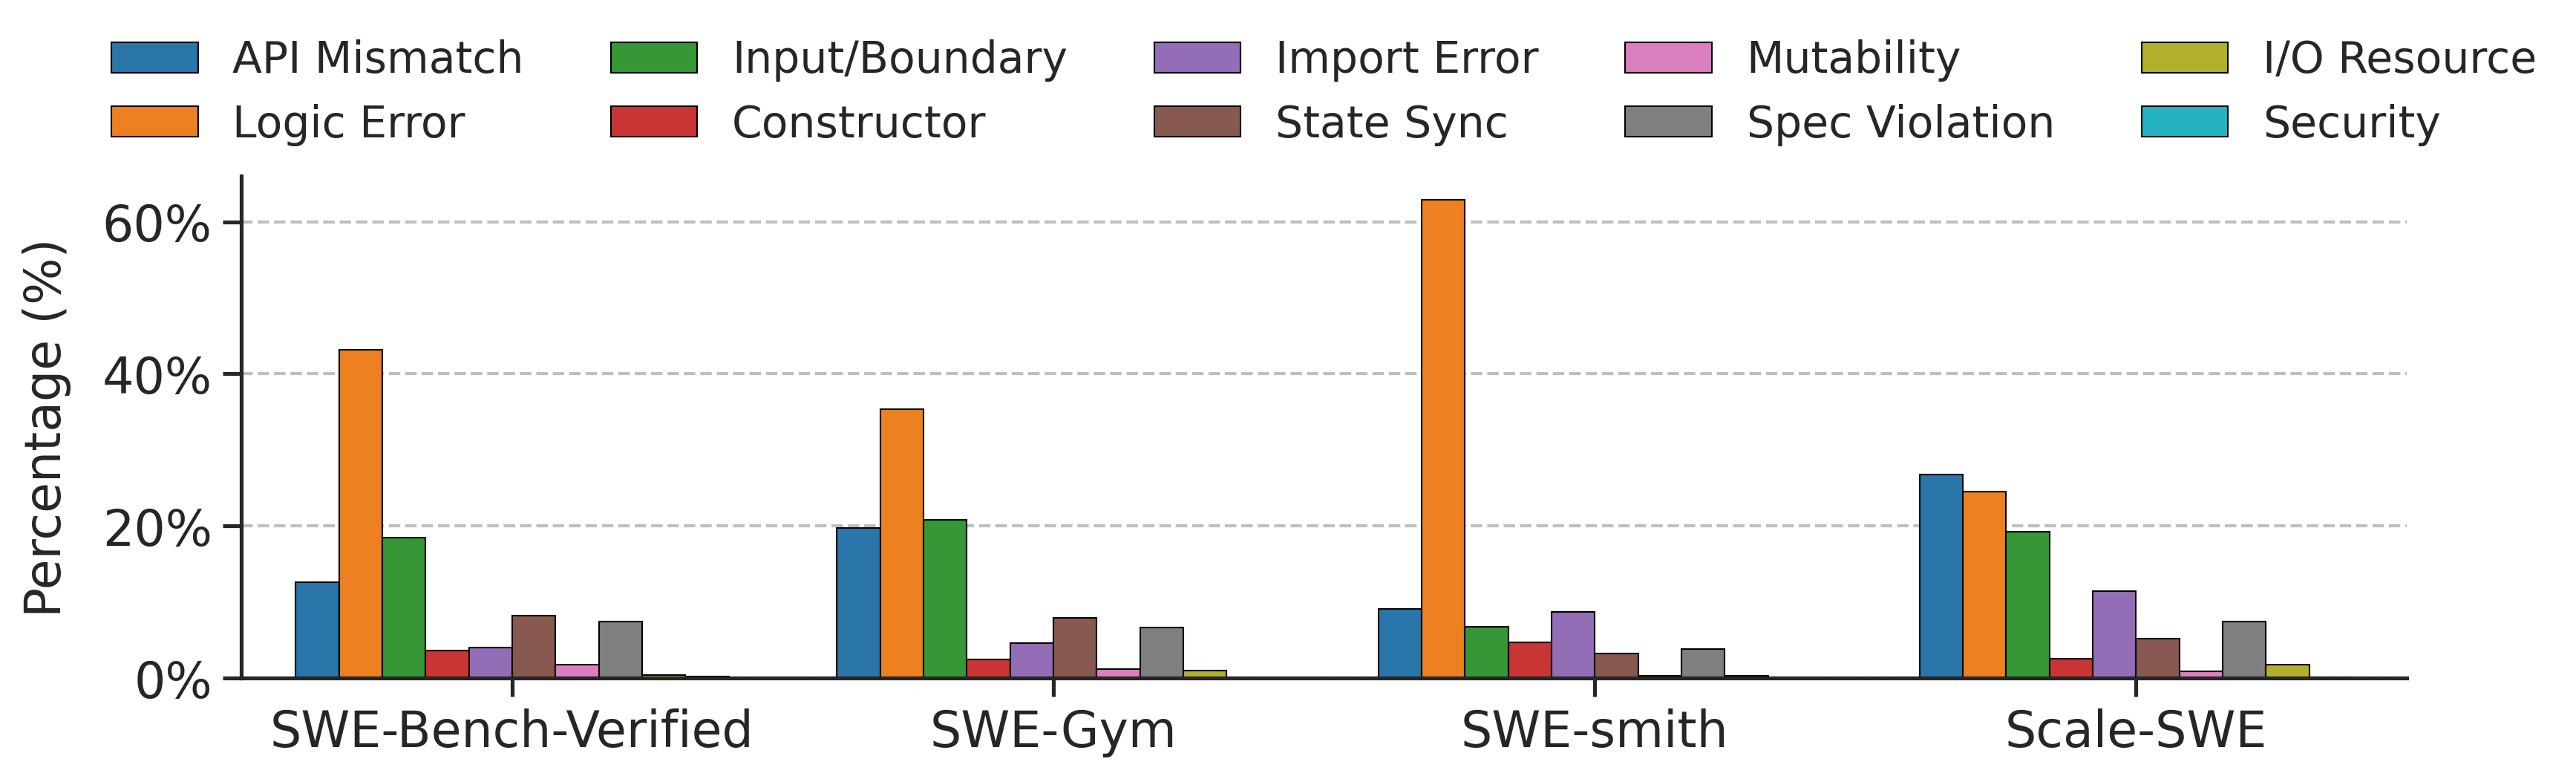
This bar chart displays the distribution of different types of software errors across four benchmarks: SWE-Bench-Verified, SWE-Gym, SWE-smith, and Scale-SWE. The y-axis represents the percentage of errors, ranging from 0% to 60%. Each benchmark has a set of bars, each representing a specific error type.
### Components/Axes
* **X-axis:** Benchmarks - SWE-Bench-Verified, SWE-Gym, SWE-smith, Scale-SWE
* **Y-axis:** Percentage (%) - Scale from 0% to 60% with increments of 10%.
* **Legend (Top-Right):**
* API Mismatch (Blue)
* Input/Boundary (Orange)
* Import Error (Purple)
* Mutability (Pink)
* I/O Resource (Yellow)
* Logic Error (Brown)
* Constructor (Red)
* State Sync (Gray)
* Spec Violation (Green)
* Security (Teal)
### Detailed Analysis
The chart consists of four groups of bars, one for each benchmark. Within each group, there are ten bars, each representing a different error type.
**SWE-Bench-Verified:**
* API Mismatch: Approximately 12%
* Input/Boundary: Approximately 42%
* Import Error: Approximately 2%
* Mutability: Approximately 2%
* I/O Resource: Approximately 10%
* Logic Error: Approximately 10%
* Constructor: Approximately 2%
* State Sync: Approximately 4%
* Spec Violation: Approximately 8%
* Security: Approximately 10%
**SWE-Gym:**
* API Mismatch: Approximately 22%
* Input/Boundary: Approximately 36%
* Import Error: Approximately 2%
* Mutability: Approximately 2%
* I/O Resource: Approximately 2%
* Logic Error: Approximately 4%
* Constructor: Approximately 2%
* State Sync: Approximately 2%
* Spec Violation: Approximately 20%
* Security: Approximately 10%
**SWE-smith:**
* API Mismatch: Approximately 2%
* Input/Boundary: Approximately 2%
* Import Error: Approximately 4%
* Mutability: Approximately 2%
* I/O Resource: Approximately 2%
* Logic Error: Approximately 2%
* Constructor: Approximately 2%
* State Sync: Approximately 2%
* Spec Violation: Approximately 60%
* Security: Approximately 2%
**Scale-SWE:**
* API Mismatch: Approximately 20%
* Input/Boundary: Approximately 10%
* Import Error: Approximately 8%
* Mutability: Approximately 2%
* I/O Resource: Approximately 2%
* Logic Error: Approximately 2%
* Constructor: Approximately 2%
* State Sync: Approximately 2%
* Spec Violation: Approximately 20%
* Security: Approximately 20%
### Key Observations
* **Input/Boundary errors** are consistently high across all benchmarks, particularly in SWE-Bench-Verified and SWE-Gym.
* **Spec Violation** dominates the error distribution in SWE-smith, accounting for approximately 60% of the errors.
* **API Mismatch** is most prominent in Scale-SWE, reaching approximately 20%.
* **Import Error, Mutability, I/O Resource, Logic Error, Constructor, and State Sync** errors are generally low across all benchmarks, typically below 10%.
### Interpretation
The chart reveals significant differences in the types of errors prevalent in different software benchmarks. The high prevalence of Input/Boundary errors across all benchmarks suggests a common weakness in handling input validation and boundary conditions. The dominance of Spec Violation errors in SWE-smith indicates that this benchmark may be particularly sensitive to deviations from specified behavior. The varying distribution of API Mismatch and Security errors suggests that these issues are more specific to certain benchmarks or software contexts.
The data suggests that error profiles are benchmark-specific. This implies that different benchmarks test different aspects of software quality and robustness. The chart could be used to prioritize testing and code review efforts based on the error patterns observed in each benchmark. For example, focusing on input validation for SWE-Bench-Verified and SWE-Gym, and on specification adherence for SWE-smith. The relatively low occurrence of certain error types (e.g., Mutability, State Sync) might indicate that existing development practices or tools are effective in preventing these issues.