## Line Chart: Mstencil/s Performance Across Input Lengths
### Overview
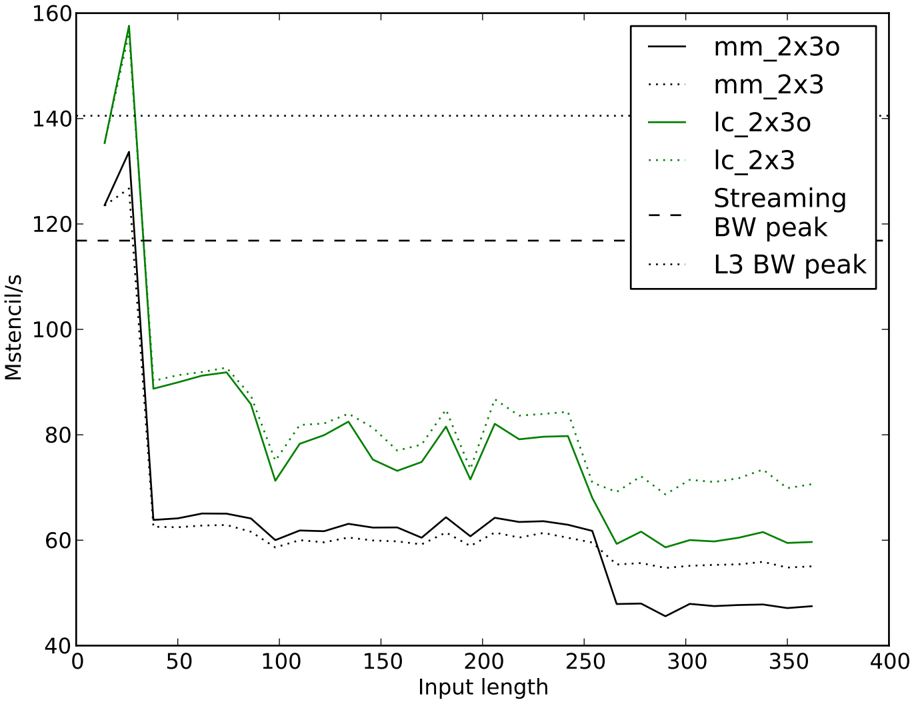
The chart displays the performance of multiple configurations (measured in Mstencil/s) as input length increases from 0 to 400. Key trends include sharp initial drops followed by stabilization or fluctuation, with distinct patterns for each configuration.
### Components/Axes
- **X-axis (Input length)**: Ranges from 0 to 400 in increments of 50.
- **Y-axis (Mstencil/s)**: Ranges from 40 to 160 in increments of 20.
- **Legend**: Located in the top-right corner, with the following entries:
- Solid black: `mm_2x3o`
- Dotted black: `mm_2x3`
- Solid green: `lc_2x3o`
- Dotted green: `lc_2x3`
- Dashed black: `Streaming`
- Dash-dot green: `BW peak`
- Dotted black: `L3 BW peak`
### Detailed Analysis
1. **`mm_2x3o` (Solid black)**:
- Starts at ~140 Mstencil/s at input length 0.
- Drops sharply to ~60 by input length 50.
- Fluctuates between 60–70 for input lengths 100–350.
2. **`lc_2x3o` (Solid green)**:
- Starts at ~150 Mstencil/s at input length 0.
- Drops to ~80 by input length 50.
- Fluctuates between 60–80 for input lengths 100–350.
3. **`lc_2x3` (Dotted green)**:
- Starts at ~80 Mstencil/s at input length 0.
- Drops to ~60 by input length 50.
- Fluctuates between 60–80 for input lengths 100–350.
4. **`Streaming` (Dashed black)**:
- Starts at ~120 Mstencil/s at input length 0.
- Drops to ~50 by input length 50.
- Fluctuates between 50–60 for input lengths 100–350.
5. **`BW peak` (Dash-dot green)**:
- Starts at ~140 Mstencil/s at input length 0.
- Drops to ~60 by input length 50.
- Fluctuates between 60–70 for input lengths 100–350.
6. **`L3 BW peak` (Dotted black)**:
- Starts at ~140 Mstencil/s at input length 0.
- Drops to ~60 by input length 50.
- Fluctuates between 60–70 for input lengths 100–350.
### Key Observations
- **Initial Drop**: All configurations experience a sharp performance drop (~50% reduction) between input lengths 0–50.
- **Stabilization**: After input length 50, performance stabilizes or fluctuates within narrow ranges.
- **Highest Initial Performance**: `lc_2x3o` (solid green) achieves the highest starting value (~150 Mstencil/s).
- **Lowest Sustained Performance**: `Streaming` (dashed black) maintains the lowest values (~50–60 Mstencil/s) after input length 50.
- **Similar Patterns**: `BW peak` and `L3 BW peak` lines exhibit nearly identical trends, suggesting shared characteristics.
### Interpretation
The chart likely represents computational or data processing performance metrics across different hardware/software configurations. The initial drop may reflect setup overhead or resource allocation delays. Configurations with higher initial performance (`lc_2x3o`, `mm_2x3o`) degrade less sharply than others, indicating better scalability or optimization. The `Streaming` configuration’s consistently low values suggest it prioritizes throughput over peak performance. The `BW peak` and `L3 BW peak` lines imply bandwidth thresholds or limits influencing performance. The stabilization phase after input length 50 highlights a transition from initialization to steady-state operation.