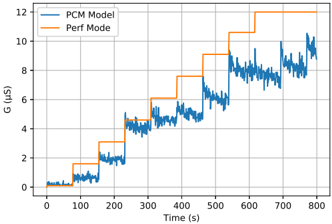
## Chart: PCM Model vs Perf Mode
### Overview
The image is a line graph comparing the performance of a "PCM Model" against "Perf Mode" over time. The graph shows the conductance (G) in microSiemens (µS) on the y-axis and time in seconds (s) on the x-axis. The PCM Model is represented by a fluctuating blue line, while Perf Mode is represented by a stepped orange line.
### Components/Axes
* **Title:** None explicitly given in the image.
* **X-axis:** Time (s), ranging from 0 to 800 seconds. Axis markers are present at intervals of 100 seconds.
* **Y-axis:** G (µS), representing conductance in microSiemens, ranging from 0 to 12. Axis markers are present at intervals of 2 µS.
* **Legend:** Located in the top-left corner.
* Blue line: PCM Model
* Orange line: Perf Mode
### Detailed Analysis
* **PCM Model (Blue Line):** The blue line generally increases over time, with fluctuations around each step.
* From 0 to 100s, the value fluctuates around 0.5 µS.
* From 100 to 200s, the value fluctuates around 1.8 µS.
* From 200 to 300s, the value fluctuates around 4.5 µS.
* From 300 to 400s, the value fluctuates around 5.5 µS.
* From 400 to 500s, the value fluctuates around 7.5 µS.
* From 500 to 600s, the value fluctuates around 8.5 µS.
* From 600 to 700s, the value fluctuates around 8.0 µS.
* From 700 to 800s, the value fluctuates around 9.0 µS.
* **Perf Mode (Orange Line):** The orange line increases in discrete steps over time.
* From 0 to 100s, the value is approximately 0 µS.
* From 100 to 200s, the value is approximately 3 µS.
* From 200 to 300s, the value is approximately 5 µS.
* From 300 to 400s, the value is approximately 7 µS.
* From 400 to 500s, the value is approximately 9 µS.
* From 500 to 600s, the value is approximately 11 µS.
* From 600 to 700s, the value is approximately 12 µS.
* From 700 to 800s, the value is approximately 12 µS.
### Key Observations
* The PCM Model exhibits more variability than Perf Mode.
* Perf Mode increases in distinct steps, while the PCM Model shows a more continuous, albeit fluctuating, increase.
* The PCM Model generally tracks the steps of Perf Mode but with added noise.
### Interpretation
The graph compares the conductance of a PCM Model to a Perf Mode over time. The Perf Mode appears to be a target or ideal performance level, increasing in discrete steps. The PCM Model attempts to follow this target, but its performance fluctuates around the target values. This suggests that the PCM Model is trying to achieve the performance levels set by the Perf Mode, but it is subject to variability or noise. The stepped nature of the Perf Mode could represent different operational states or target conductance levels, while the PCM Model's fluctuations could be due to factors such as environmental conditions, material properties, or control system limitations. The PCM Model never exceeds the Perf Mode.