TECHNICAL ASSET FINGERPRINT
e70a16f5f046c1d307351c80
Click to view fullscreen
Press ESC or click to close
FOUND IN PAPERS
EXPERT: gemini-2.0-flash VERSION 1
RUNTIME: nugit/gemini/gemini-2.0-flash
INTEL_VERIFIED
## Line Chart: Evaluation on Task
### Overview
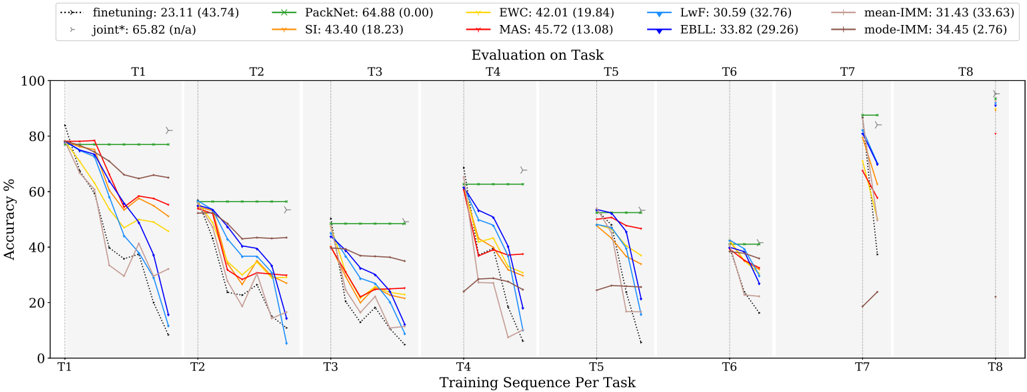
The image is a line chart comparing the performance of different continual learning algorithms across a sequence of tasks (T1 to T8). The y-axis represents accuracy percentage, and the x-axis represents the training sequence per task. Each line represents a different algorithm, and the chart shows how the accuracy of each algorithm changes as it is trained on successive tasks.
### Components/Axes
* **X-axis:** Training Sequence Per Task (T1, T2, T3, T4, T5, T6, T7, T8)
* **Y-axis:** Accuracy % (Scale from 0 to 100)
* **Title:** Evaluation on Task
* **Legend (Top-Left):**
* finetuning (dotted black line): 23.11 (43.74)
* joint\* (gray line with triangle markers): 65.82 (n/a)
* PackNet (green line): 64.88 (0.00)
* SI (orange line): 43.40 (18.23)
* EWC (yellow line): 42.01 (19.84)
* MAS (red line): 45.72 (13.08)
* LwF (light blue line): 30.59 (32.76)
* EBLL (dark blue line): 33.82 (29.26)
* mean-IMM (brown line): 31.43 (33.63)
* mode-IMM (purple line): 34.45 (2.76)
### Detailed Analysis
The chart is divided into eight sections, one for each task (T1 to T8). Each section shows the accuracy of the different algorithms after training on that task.
* **finetuning (dotted black line):** Starts high and consistently decreases across all tasks.
* **joint\* (gray line with triangle markers):** Remains relatively stable and high across all tasks.
* **PackNet (green line):** Remains constant across all tasks.
* **SI (orange line):** Starts high and decreases across tasks.
* **EWC (yellow line):** Starts high and decreases across tasks.
* **MAS (red line):** Starts high and decreases across tasks.
* **LwF (light blue line):** Starts high and decreases across tasks.
* **EBLL (dark blue line):** Starts high and decreases across tasks.
* **mean-IMM (brown line):** Starts high and decreases across tasks.
* **mode-IMM (purple line):** Starts high and decreases across tasks.
**Task 1 (T1):**
* finetuning: Starts at approximately 78% and decreases.
* joint\*: Starts at approximately 82%.
* PackNet: Starts at approximately 78%.
* SI: Starts at approximately 76%.
* EWC: Starts at approximately 74%.
* MAS: Starts at approximately 78%.
* LwF: Starts at approximately 76%.
* EBLL: Starts at approximately 78%.
* mean-IMM: Starts at approximately 78%.
* mode-IMM: Starts at approximately 78%.
**Task 2 (T2):**
* finetuning: Decreases to approximately 38%.
* joint\*: Remains at approximately 82%.
* PackNet: Remains at approximately 57%.
* SI: Decreases to approximately 58%.
* EWC: Decreases to approximately 54%.
* MAS: Decreases to approximately 56%.
* LwF: Decreases to approximately 56%.
* EBLL: Decreases to approximately 58%.
* mean-IMM: Decreases to approximately 66%.
* mode-IMM: Decreases to approximately 64%.
**Task 3 (T3):**
* finetuning: Decreases to approximately 24%.
* joint\*: Remains at approximately 82%.
* PackNet: Remains at approximately 50%.
* SI: Decreases to approximately 40%.
* EWC: Decreases to approximately 36%.
* MAS: Decreases to approximately 38%.
* LwF: Decreases to approximately 36%.
* EBLL: Decreases to approximately 38%.
* mean-IMM: Decreases to approximately 40%.
* mode-IMM: Decreases to approximately 40%.
**Task 4 (T4):**
* finetuning: Decreases to approximately 10%.
* joint\*: Remains at approximately 82%.
* PackNet: Remains at approximately 64%.
* SI: Decreases to approximately 20%.
* EWC: Decreases to approximately 20%.
* MAS: Decreases to approximately 20%.
* LwF: Decreases to approximately 20%.
* EBLL: Decreases to approximately 20%.
* mean-IMM: Decreases to approximately 30%.
* mode-IMM: Decreases to approximately 30%.
**Task 5 (T5):**
* finetuning: Increases to approximately 10%.
* joint\*: Remains at approximately 82%.
* PackNet: Remains at approximately 52%.
* SI: Increases to approximately 48%.
* EWC: Increases to approximately 50%.
* MAS: Increases to approximately 52%.
* LwF: Increases to approximately 52%.
* EBLL: Increases to approximately 52%.
* mean-IMM: Increases to approximately 48%.
* mode-IMM: Increases to approximately 48%.
**Task 6 (T6):**
* finetuning: Decreases to approximately 20%.
* joint\*: Remains at approximately 82%.
* PackNet: Remains at approximately 50%.
* SI: Decreases to approximately 38%.
* EWC: Decreases to approximately 38%.
* MAS: Decreases to approximately 38%.
* LwF: Decreases to approximately 38%.
* EBLL: Decreases to approximately 38%.
* mean-IMM: Decreases to approximately 38%.
* mode-IMM: Decreases to approximately 38%.
**Task 7 (T7):**
* finetuning: Decreases to approximately 10%.
* joint\*: Remains at approximately 82%.
* PackNet: Remains at approximately 90%.
* SI: Decreases to approximately 68%.
* EWC: Decreases to approximately 66%.
* MAS: Decreases to approximately 64%.
* LwF: Decreases to approximately 72%.
* EBLL: Decreases to approximately 74%.
* mean-IMM: Decreases to approximately 68%.
* mode-IMM: Decreases to approximately 68%.
**Task 8 (T8):**
* finetuning: Decreases to approximately 10%.
* joint\*: Remains at approximately 96%.
* PackNet: Remains at approximately 96%.
* SI: Remains at approximately 96%.
* EWC: Remains at approximately 96%.
* MAS: Remains at approximately 96%.
* LwF: Remains at approximately 96%.
* EBLL: Remains at approximately 96%.
* mean-IMM: Remains at approximately 96%.
* mode-IMM: Remains at approximately 96%.
### Key Observations
* The "joint\*" algorithm consistently maintains high accuracy across all tasks.
* The "PackNet" algorithm maintains a relatively stable accuracy across all tasks.
* The "finetuning" algorithm experiences a significant drop in accuracy as the training sequence progresses, indicating catastrophic forgetting.
* Other algorithms (SI, EWC, MAS, LwF, EBLL, mean-IMM, mode-IMM) show a decline in accuracy as the training sequence progresses, but not as severe as "finetuning".
### Interpretation
The chart demonstrates the challenge of continual learning, where models tend to forget previously learned tasks when trained on new ones. The "joint\*" algorithm serves as an upper bound, showing the performance that can be achieved when all tasks are learned jointly. The "finetuning" algorithm highlights the problem of catastrophic forgetting. The other algorithms represent different approaches to mitigate catastrophic forgetting, with varying degrees of success. The performance drop observed in most algorithms suggests that continual learning remains a challenging problem, and further research is needed to develop more robust algorithms.
DECODING INTELLIGENCE...
EXPERT: gemini-3.1-flash-lite-preview-free VERSION 1
RUNTIME: google-free/gemini-3.1-flash-lite-preview
INTEL_VERIFIED
## Line Chart: Continual Learning Task Accuracy Evaluation
### Overview
This image displays a faceted line chart comparing the performance (Accuracy %) of various continual learning algorithms across a sequence of eight tasks (T1 through T8). The chart illustrates how different models retain knowledge of previous tasks as they are trained on subsequent tasks. The X-axis represents the training sequence, while the Y-axis measures accuracy. The chart is divided into eight vertical panels, each representing the evaluation state after training on that specific task.
### Components/Axes
* **Y-Axis:** "Accuracy %", ranging from 0 to 100.
* **X-Axis:** "Training Sequence Per Task", labeled T1 through T8.
* **Legend (Top Center):** Lists the algorithms and their associated performance metrics (Average Accuracy and Standard Deviation).
| Algorithm | Line Style/Color | Metric 1 | Metric 2 |
| :--- | :--- | :--- | :--- |
| **finetuning** | Black dotted line | 23.11 | (43.74) |
| **joint*** | Grey arrow | 65.82 | (n/a) |
| **PackNet** | Green line with 'x' markers | 64.88 | (0.00) |
| **SI** | Orange line with '+' markers | 43.40 | (18.23) |
| **EWC** | Yellow line | 42.01 | (19.84) |
| **MAS** | Red line | 45.72 | (13.08) |
| **LwF** | Light Blue line | 30.59 | (32.76) |
| **EBLL** | Dark Blue line with triangle markers | 33.82 | (29.26) |
| **mean-IMM** | Pink/Light Red line with '+' markers | 31.43 | (33.63) |
| **mode-IMM** | Brown line with '+' markers | 34.45 | (2.76) |
### Detailed Analysis
The chart is segmented into eight panels (T1-T8). Each panel shows the accuracy of the models on the tasks learned *up to that point*.
* **T1 Panel:** All models begin with high accuracy, clustering around 80%. `finetuning` (black dotted) shows the steepest decline as the sequence progresses within this panel.
* **T2 Panel:** `PackNet` (green) maintains a flat, high accuracy (~55%). All other models show a downward trend, with `finetuning` dropping the lowest.
* **T3 Panel:** `PackNet` remains stable at ~48%. The other models continue to show degradation, with `finetuning` and `LwF` (light blue) showing the most significant drops.
* **T4 Panel:** `PackNet` remains stable at ~62%. `finetuning` drops sharply to near 0%.
* **T5 Panel:** `PackNet` remains stable at ~52%. Other models show varying degrees of degradation, with `MAS` (red) and `EWC` (yellow) performing slightly better than the others.
* **T6 Panel:** `PackNet` remains stable at ~40%. The other models are clustered between 20% and 40%.
* **T7 Panel:** Only `PackNet` and `joint*` (grey arrow) are visible at high accuracy levels (~80%). Most other models have dropped significantly.
* **T8 Panel:** Only the `joint*` benchmark is visible at the top (~95%).
### Key Observations
* **Catastrophic Forgetting:** The `finetuning` method (black dotted line) exhibits the most severe "catastrophic forgetting," where accuracy drops precipitously as new tasks are introduced.
* **PackNet Stability:** `PackNet` (green) is the clear outlier in terms of stability. It maintains a nearly flat line across all panels, indicating it does not suffer from catastrophic forgetting. This is likely due to its architectural approach (parameter isolation/masking).
* **The `joint*` Benchmark:** The `joint*` (grey arrow) represents the theoretical upper bound, as it is trained on all data simultaneously. It consistently sits at the top of the performance range.
* **Performance Clustering:** Most regularization-based methods (EWC, SI, MAS, LwF, IMM variants) cluster in the middle-to-lower performance range, showing a clear downward trend in accuracy as the task sequence increases.
### Interpretation
This chart is a classic visualization of the "Stability-Plasticity Dilemma" in machine learning.
* **What the data demonstrates:** It shows that standard `finetuning` is insufficient for continual learning because the model overwrites weights learned for previous tasks to accommodate new ones.
* **Why it matters:** The chart highlights that architectural approaches like `PackNet` (which likely freezes weights or uses masks to protect previous knowledge) are far more effective at retaining performance than regularization-based methods (like EWC or SI) which attempt to constrain weight updates.
* **Reading between the lines:** The `PackNet` line being perfectly flat suggests it is effectively partitioning the network capacity for each task. While this solves the forgetting problem, it implies that the model capacity is finite; eventually, `PackNet` would run out of parameters to allocate to new tasks, whereas the other methods might continue to learn (albeit with forgetting). The `joint*` benchmark serves as the "gold standard" that other methods strive to approach.
DECODING INTELLIGENCE...
EXPERT: nemotron-free VERSION 1
RUNTIME: free/nvidia/nemotron-nano-12b-v2-vl:free
INTEL_VERIFIED
## Line Graph: Evaluation on Task
### Overview
The image is a multi-line graph comparing the accuracy performance of various machine learning methods across eight sequential tasks (T1–T8). The y-axis represents accuracy percentage (0–100%), and the x-axis represents training sequences per task. The graph includes eight distinct data series, each represented by a unique color and marker, with a legend in the top-left corner. Key trends show significant performance decay for most methods over time, with one method maintaining near-constant high performance.
### Components/Axes
- **X-axis**: "Training Sequence Per Task" (T1 to T8)
- **Y-axis**: "Accuracy %" (0–100%)
- **Legend**: Located in the top-left corner, listing:
- PackNet (green dashed line with 'x' markers)
- EWC (orange solid line with '+' markers)
- MAS (red solid line with 'o' markers)
- LwF (blue solid line with '▼' markers)
- EBLL (purple solid line with '▲' markers)
- Finetuning (black dotted line with '▶' markers)
- Joint* (gray dashed line with '▶' markers)
- mean-IMM (brown dashed line with '▶' markers)
- mode-IMM (dark brown dashed line with '▶' markers)
- **Task Labels**: T1–T8 positioned below the x-axis.
### Detailed Analysis
1. **PackNet (Green)**:
- Starts at 64.88% (T1) and remains relatively stable, with minor fluctuations (e.g., 58.32% at T2, 55.11% at T3).
- Maintains the highest accuracy across all tasks, ending at 64.88% (T8).
2. **EWC (Orange)**:
- Begins at 42.01% (T1), peaks at 45.72% (T3), then declines to 30.59% (T8).
3. **MAS (Red)**:
- Starts at 45.72% (T1), drops to 33.82% (T4), and stabilizes around 31.43% (T8).
4. **LwF (Blue)**:
- Declines sharply from 30.59% (T1) to 18.23% (T8), with significant drops at T4 and T6.
5. **EBLL (Purple)**:
- Starts at 33.82% (T1), declines to 29.26% (T8), with a notable dip at T5.
6. **Finetuning (Black Dotted)**:
- Peaks at 23.11% (T1), drops to 13.08% (T8), with erratic fluctuations.
7. **Joint* (Gray Dashed)**:
- Starts at 65.82% (T1), declines to 34.45% (T8), with sharp drops at T4 and T7.
8. **mean-IMM (Brown Dashed)**:
- Starts at 31.43% (T1), declines to 27.63% (T8), with minor fluctuations.
9. **mode-IMM (Dark Brown Dashed)**:
- Starts at 34.45% (T1), declines to 27.63% (T8), with a sharp drop at T6.
### Key Observations
- **PackNet** consistently outperforms all other methods, maintaining near-constant accuracy (64.88% ± 0.00) across all tasks.
- **LwF** and **Finetuning** exhibit the steepest declines, suggesting poor generalization to new tasks.
- **Joint*** and **EWC** show moderate decay but retain higher accuracy than most methods after T4.
- **mean-IMM** and **mode-IMM** demonstrate gradual declines, with mode-IMM outperforming mean-IMM slightly in later tasks.
- **MAS** and **EBLL** show intermediate performance, with MAS declining more sharply than EBLL.
### Interpretation
The data suggests that **PackNet** is the most robust method for sequential task learning, maintaining high accuracy without significant decay. This implies superior generalization capabilities compared to other methods. In contrast, **LwF** and **Finetuning** suffer from catastrophic forgetting, as their accuracy drops sharply with each new task. The **Joint*** method, while initially high-performing, also shows substantial decay, indicating potential limitations in handling task sequences. The **mean-IMM** and **mode-IMM** methods, while less effective than PackNet, demonstrate more stability than LwF or Finetuning, suggesting they may balance adaptation and retention better. The consistent performance of PackNet across all tasks highlights its effectiveness in mitigating catastrophic forgetting, a critical challenge in continual learning scenarios.
DECODING INTELLIGENCE...